diamond, there are identified graphite and carbon, while the amorphous material is also significant (26%). The diamond peaks show a significant base (2theta) which means that the structure of this phase is probably crypocrystallic and also are symmetrical which means that the diamond phase is well crystallized. The BG/ND sample presents two strong peaks at about 10-13 o 2theta and 25-37 o 2theta, while there are two less intense peaks at about 17-24 o 2theta and 28-55 o 2theta. Significantly, the first peak (10-13 o 2theta) is less intense to the pure BG sample, which indicates a possible transition from the amorphous state to a primary amorphous-cryptocrystallic state. Additionally, the amorphous part of the pure ND sample affects the total amount and the morphology of amorphous in the BG/ND sample, while the peak between 28-55 o 2theta can be attributed to the cryptocrystallic structure of diamond that appears between 43-44 ο 2theta. Amorphous SCS: Sodium Calcium Silicate, Ca SiO 86-0399 ICDD card D: Diamond, C, 06-0675 ICDD card G: Graphite, C, 75-2078 ICDD card C: Carbon, C, 26-1069 ICDD card C G ND pure D SCS SCS 5 15 25 35 45 55 65 75 SCS Amorphous SCS SCS BG/ND SCS SCS SCS SCS SCS SCS SCS 5 10 15 20 25 30 35 40 45 50 55 60 65 70 75 BG pure 80 Amorphous 5 10 15 20 25 30 35 40 45 50 55 60 65 70 75 80 D Fig. 1. XRD patterns of the BG/ND system and of pure BG and ND In Fig. 2 are presented the FTIR spectra of the BG/ND system and pure BG before and after the immersion in c-SBF, for 6, 12 and 24 hours. In the spectra of both samples before the immersion, is observed a broad trend between 840 and 1370cm -1 that can be attributed to the amorphous phase of the samples. The two shoulders at 850 and 965 cm -1 can be assigned to the crystalline phase of dicalcium silicate (Ca 2 SiO 4 ) [9] . Finally, the strong band at 460cm -1 occurs due to the bending mode of Si-O-Si. After 6 hours of soaking, a new band appears at 585cm -1 in both BG/ND system and pure BG, which corresponds to the antisymmetric vibrational mode of P-O in amorphous calcium phosphate phase. After 12 hours in c-SBF, the IR spectrum of both samples is analogous to that observed after 6 hours. However, after 24 hours a double peak at 568 and 602cm -1 is developed to both samples, that are attributed to the bending of P-O mode and proves the development of a crystalline phase of HCAp layer [10] . Comparing the bioactive response of both samples with that of the commercial sol-gel derived bioactive glass [7] (Bioglass® 58S) proves a retardation of our samples, that is probably caused by the growth of the crystalline phase of dicalcium silicate (Ca 2 SiO 4 ). Conclusions The XRD pattern of the BG/ND system indicates that the nanodiamonds result in the re-arrangement of the BG amorphous phase, producing an amorphous phase with a primary amorphous-cryptocrystallic structure. The fact that this new phase is also highly bioactive, even though there is a small retardation of bioactive response in comparison with pure Bioglass® 58S, makes the sol-gel-derived BG/ND system a promising bioactive composite. 2 4 References [1]. Hench LL, Splinter RJ, Allen WC., J Biomed Mater Res, 2, 117, 1971 [2]. Saravanapavan P., Jones J., Pryce R., Hench L., J Biomed Mater Res A., 66, 110, 2003 [3]. Hench L.L. and Andersson O. in An introduction to Bioceramics, editors: Hench L.L. and Wilson J., World Scientific, 41, 1993 [4]. Ekimov E.A., Gromnitskaya E.L., Gierlotka S., Lojkowski W., Palosz B., Swiderska-Sroda A., Kozubowski J.A. and Naletov A.M., J. of Materials science letters, 21, 1699 , 2002 [5]. Kulakova I. I., Physics of the Solid State, 46, 636, 2004 [6]. Xu K. and Xue Q., Physics of the solid state, 46, 649, 2004 [7]. Zhong J., Greenspan D., J Biomed Mater Res, 53, 694, 2000 [8]. Ohtsuki C., Kushitani H., Kokubo T., Kotani S., Yamamuro T., J Biomed Mater Res, 25, 1363, 1991 400 600 800 1000 1200 1400 1600 [9]. Henning O., Cements: the Hydrated Silicates and Aluminates in The Infrared Spectra of Minerals, editor: Farmer V.C. London, Mineralogical Society, 1974 [10]. Kontonasaki E., Zorba T., Papadopoulou L., Pavlidou E., Chatzistavrou X.., Paraskevopoulos K., Koidis P., Cryst. res. technol., 37, 1165, 2002 Absorbance 24h 12h 6h 0h wavelength (cm -1 ) BG/ND pure BG Fig.2. FTIR spectra of pure BG and the BG/ND system before and after 6, 12 and 24h of immersion in c-SBF 183
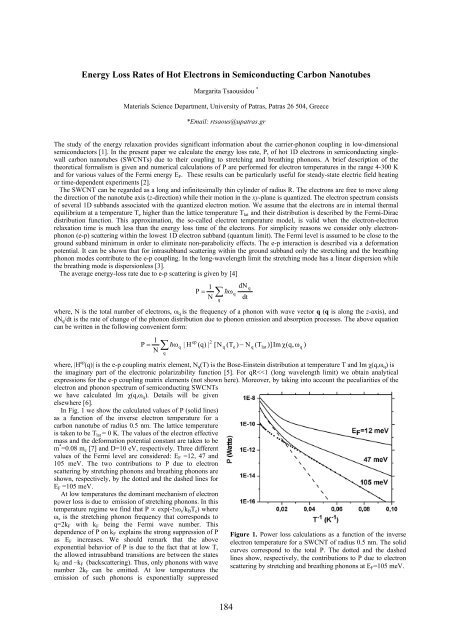
Energy Loss Rates of Hot Electrons in Semiconducting Carbon Nanotubes Margarita Tsaousidou * Materials Science Department, University of Patras, Patras 26 504, Greece *Email: rtsaous@upatras.gr The study of the energy relaxation provides significant information about the carrier-phonon coupling in low-dimensional semiconductors [1]. In the present paper we calculate the energy loss rate, P, of hot 1D electrons in semiconducting singlewall carbon nanotubes (SWCNTs) due to their coupling to stretching and breathing phonons. A brief description of the theoretical formalism is given and numerical calculations of P are performed for electron temperatures in the range 4-300 K and for various values of the Fermi energy E F . These results can be particularly useful for steady-state electric field heating or time-dependent experiments [2]. The SWCNT can be regarded as a long and infinitesimally thin cylinder of radius R. The electrons are free to move along the direction of the nanotube axis (z-direction) while their motion in the xy-plane is quantized. The electron spectrum consists of several 1D subbands associated with the quantized electron motion. We assume that the electrons are in internal thermal equilibrium at a temperature T e higher than the lattice temperature T lat and their distribution is described by the Fermi-Dirac distribution function. This approximation, the so-called electron temperature model, is valid when the electron-electron relaxation time is much less than the energy loss time of the electrons. For simplicity reasons we consider only electronphonon (e-p) scattering within the lowest 1D electron subband (quantum limit). The Fermi level is assumed to be close to the ground subband minimum in order to eliminate non-parabolicity effects. The e-p interaction is described via a deformation potential. It can be shown that for intrasubband scattering within the ground subband only the stretching and the breathing phonon modes contribute to the e-p coupling. In the long-wavelength limit the stretching mode has a linear dispersion while the breathing mode is dispersionless [3]. The average energy-loss rate due to e-p scattering is given by [4] P = 1 N ∑ q ω where, N is the total number of electrons, ω q is the frequency of a phonon with wave vector q (q is along the z-axis), and dN q /dt is the rate of change of the phonon distribution due to phonon emission and absorption processes. The above equation can be written in the following convenient form: q dΝ dt 1 ep 2 P = ∑ ω | H ( q) | [ N q ( Te ) − N q ( Tlat )] Im χ(q, ω N q q q ) where, |H ep (q)| is the e-p coupling matrix element, N q (T) is the Bose-Einstein distribution at temperature T and Im χ(q,ω q ) is the imaginary part of the electronic polarizability function [5]. For qR
- Page 1 and 2:
XXIII ΠΑΝΕΛΛΗΝΙΟ ΣΥΝΕ
- Page 3 and 4:
Κοιτώντας τα πρακτ
- Page 5 and 6:
ΕΠΙΤΡΟΠΕΣ Οργανωτι
- Page 7 and 8:
ΠΡΟΓΡΑΜΜΑ ΣΥΝΕΔΡΙΟ
- Page 9 and 10:
21. Οργανικά τρανζίσ
- Page 11 and 12:
15:30 15:45 16:00 16:15 16:30 16:45
- Page 13 and 14:
41. Modeling and quantitative phase
- Page 15 and 16:
Ανοιχτή Συνεδρία «
- Page 17 and 18:
«NανοΥλικά και Νανο
- Page 19 and 20:
New materials and MOS device concep
- Page 21 and 22:
Reliability Characteristics of Rare
- Page 23 and 24:
Ο λόγος των ταχυτήτ
- Page 25 and 26:
Thus the mean R In-In is expected t
- Page 27 and 28:
FIG 1. Schematic representation of
- Page 29 and 30:
με 0.80 eV στη διεπιφά
- Page 31 and 32:
Εντοπισµός Φορέων
- Page 33 and 34:
Παρασκευή και Xαρακ
- Page 35 and 36:
Electrical Spin Injection from Fe i
- Page 37 and 38:
Electrical Spin Injection of Spin-P
- Page 39 and 40:
References [1] CH Lee, J. Meteer, V
- Page 41 and 42:
Σχήμα 1: Φωτογραφία
- Page 43 and 44:
SEM Image Layout Simulation Εικ
- Page 45 and 46:
Μελέτη Ατελειών Σε
- Page 47 and 48:
Facet-Stress-Driven Ordering in SiG
- Page 49 and 50:
νανοκρυσταλλίτης (a
- Page 51 and 52:
Σχήµα 1. Εικόνες περ
- Page 53 and 54:
Σχήµα 1. Εικόνες περ
- Page 55 and 56:
Οι δομές που αναπτύ
- Page 57 and 58:
Raman Intensity (10 -50 cm 3 ) 1,2
- Page 59 and 60:
Μελέτη της Επίδρασ
- Page 61 and 62:
Annealing Induced Dissociation of N
- Page 63 and 64:
`Εναπόθεση με Παλμι
- Page 65 and 66:
Μελέτη της Χημείας
- Page 67 and 68:
Ανάπτυξη Νέων Μεσο
- Page 69 and 70:
Application of Thermal Quadrupoles
- Page 71 and 72:
Στοχαστική προσομο
- Page 73 and 74:
Νανοτραχύτητα κατά
- Page 75 and 76:
Ευαισθησία και Δια
- Page 77 and 78:
Optical Properties of CuIn 1-x Ga x
- Page 79 and 80:
ανοπτημένο με λέιζ
- Page 81 and 82:
Στο σχήμα 3 φαίνοντ
- Page 83 and 84:
Id (mA) -0,3 -0,2 -0,1 Vg=0 Vg=-1 V
- Page 85 and 86:
Strained-Si Si 1-x Ge x graded Si 1
- Page 87 and 88:
Fig. 1. Laser mask movement during
- Page 89 and 90:
forwarded to the back interface dur
- Page 91 and 92:
Σχήμα 2: Εκθετική εξ
- Page 93 and 94:
V th (V) G m,max /G m,max0 (%) I d
- Page 95 and 96:
C/ C ox 1,0 0,8 0,6 0,4 0,2 0,0 -4
- Page 97 and 98:
και Ta 2 O 5 , των οποίω
- Page 99 and 100:
κατασκευή της. Η πα
- Page 101 and 102:
ΔP (mW) 12 10 8 6 4 2 0 0 500 1000
- Page 103 and 104:
υπολογίσουμε θεωρη
- Page 105 and 106:
Σχήμα 2 Σύστημα ηλε
- Page 107 and 108:
Μελέτη των Μηχανισ
- Page 109 and 110:
Ανάπτυξη και Μελέτ
- Page 111 and 112:
Structure and Magnetic Properties o
- Page 113 and 114:
Δομή και Μαγνητικέ
- Page 115 and 116:
Μετρήσεις Ειδικής
- Page 117 and 118:
Further, almost all of the observed
- Page 119 and 120:
g-factor 2.019 2.016 2.013 2.010 2.
- Page 121 and 122:
ρυθμό 4 C.min -1 , έπειτ
- Page 123 and 124:
ΜΕΛΕΤΗ ΤΟΥ ΦΑΙΝΟΜΕ
- Page 125 and 126:
Νέοι Εξαφερίτες Ba µ
- Page 127 and 128:
Crystal Structure of a new Supramol
- Page 129 and 130:
Magnetic Phase Transition in Synthe
- Page 131 and 132:
Συσχέτιση πλαστική
- Page 133 and 134:
Μετασχηματισμοί φά
- Page 135 and 136:
Μελέτη της Επίδρασ
- Page 137 and 138:
Resonant Spin Transfer Torque in Do
- Page 139 and 140:
3 η Προφορική Συνεδ
- Page 141 and 142:
technology, and e-beam lithography.
- Page 143 and 144:
ecause it reduces the calculation o
- Page 145 and 146:
Υπολογισμός Υψηλής
- Page 147 and 148:
The thermodynamic average is obtain
- Page 149 and 150:
ΑΠΟΤΕΛΕΣΜΑΤΑ Στην
- Page 151 and 152:
προερχόµενη είτε α
- Page 153 and 154:
Combining Magnetism and Ferroelectr
- Page 155 and 156: υµένια LCMO/STO (100) πολ
- Page 157 and 158: Our scheme is illustrated in Fig. 1
- Page 159 and 160: [6] . Η μελέτη του υλι
- Page 161 and 162: τα πειραµατικά µας
- Page 163 and 164: συµπύκνωµα. Αυτό επ
- Page 165 and 166: και αναδεικνύει τρ
- Page 167 and 168: P P P P P power P copolymers P and
- Page 169 and 170: Αυτο-οργάνωση και Μ
- Page 171 and 172: Viscoelastic Response of Micelles w
- Page 173 and 174: Διηλεκτρική απόκρι
- Page 175 and 176: Light - induced Reversible Hydrophi
- Page 177 and 178: Οι παραπάνω τρεις κ
- Page 179 and 180: AP-PH (a.u.) 0.4 0.3 0.2 0.1 0.0 0
- Page 181 and 182: Synthesis of Polymer Brushes onto I
- Page 183 and 184: Conformational Properties of Dendri
- Page 185 and 186: Structure and Dynamics of Branched
- Page 187 and 188: ∆οµή και ∆υναµική
- Page 189 and 190: Επίδραση της Τοπολ
- Page 191 and 192: (α) (β) Σχήμα 2: (α) Απε
- Page 193 and 194: Figure 3. Generation 4 PAMAM-H 2 O
- Page 195 and 196: Από όλα τα παραπάνω
- Page 197 and 198: Το PHEGMA είναι άμορφο
- Page 199 and 200: PS HAuCl 4 P2VP Ion loading PSP2VP
- Page 201 and 202: The nonlinear optical response of A
- Page 203 and 204: νανοσωµατίδια. Όπω
- Page 205: Bioactive Glass/Nanodiamonds system
- Page 209 and 210: Σύνθεση και Χαρακτ
- Page 211 and 212: μπορεί να ερμηνευτ
- Page 213 and 214: Nανοσυνθέτα Εποξει
- Page 215 and 216: [1] S. Iijima, Nature 354, 56 (1991
- Page 217 and 218: Figure 3: GCMC calculations for und
- Page 219 and 220: μερών, εμφανίζοντα
- Page 221 and 222: 1.0 Reflectance 1.1 1.0 0.9 0.8 0.7
- Page 223 and 224: στο συντελεστή διέ
- Page 225 and 226: ¿ÔÖØÑÒØÓÐØÖÐÒÒÖÒ¸
- Page 227 and 228: Συναπόθεση Cr - Ni σε
- Page 229 and 230: Investigation of the Structural, Mo
- Page 231 and 232: Modification of Perlite Cementitiou
- Page 233 and 234: Templated Sol-Gel Synthesis Of TiO
- Page 235 and 236: Παρασκευή Υμενίων
- Page 237 and 238: Preparation of YSZ Solid Electrolyt
- Page 239 and 240: Σύνθεση, Ανισοτροπ
- Page 241 and 242: Μελέτη ανθρώπινων
- Page 243 and 244: Local Coordination of Zn and Fe in
- Page 245 and 246: Επίδραση της Προσθ
- Page 247 and 248: Αλκαλική Σύνθεση κ
- Page 249 and 250: Μηχανικές Iδιότητε
- Page 251 and 252: The Influence of Thermal Aging on t
- Page 253 and 254: Modeling and quantitative phase ana
- Page 255 and 256: Συμβολή στη Συντήρ
- Page 257 and 258:
Κρυσταλλική Συµπερ
- Page 259 and 260:
Σύνθεση Στερεών ∆ι
- Page 261 and 262:
Fabrication and Characterization of
- Page 263 and 264:
∆ιερεύνηση δυνατό
- Page 265 and 266:
Συγκριτική αξιολόγ
- Page 267 and 268:
6 η Προφορική Συνεδ
- Page 269 and 270:
Ηλεκτρομαγνητική Α
- Page 271 and 272:
Φασματοσκοπική Μελ
- Page 273 and 274:
Thermal and Electrical Properties o
- Page 275 and 276:
Structure, Mechanical, and Optoelec
- Page 277 and 278:
Designing Nanoporous Materials for
- Page 279 and 280:
This program was developed to serve
- Page 281 and 282:
Νέα Αυτό-οργανούμε
- Page 283 and 284:
A Physical Model to Interpret the E
- Page 285 and 286:
FIR study of Ag x (As 33 S 33 Se 33
- Page 287 and 288:
Mελέτη Μεικτών Γυαλ
- Page 289 and 290:
The Structural Role of Fe and Zn in
- Page 291 and 292:
ΕΥΡΕΤΗΡΙΟ ΣΥΓΓΡΑΦΕ
- Page 293 and 294:
Κομπίτσας Μ…………
- Page 295 and 296:
ΕΥΡΕΤΗΡΙΟ ΣΥΓΓΡΑΦΕ
- Page 297:
W Watson I.M………………4 Weg