xxiii Ïανελληνιο ÏÏ Î½ÎµÎ´Ïιο ÏÏ ÏÎ¹ÎºÎ·Ï ÏÏεÏÎµÎ±Ï ÎºÎ±ÏαÏÏαÏÎ·Ï & εÏιÏÏÎ·Î¼Î·Ï ...
xxiii Ïανελληνιο ÏÏ Î½ÎµÎ´Ïιο ÏÏ ÏÎ¹ÎºÎ·Ï ÏÏεÏÎµÎ±Ï ÎºÎ±ÏαÏÏαÏÎ·Ï & εÏιÏÏÎ·Î¼Î·Ï ...
xxiii Ïανελληνιο ÏÏ Î½ÎµÎ´Ïιο ÏÏ ÏÎ¹ÎºÎ·Ï ÏÏεÏÎµÎ±Ï ÎºÎ±ÏαÏÏαÏÎ·Ï & εÏιÏÏÎ·Î¼Î·Ï ...

Create successful ePaper yourself
Turn your PDF publications into a flip-book with our unique Google optimized e-Paper software.
Local Coordination of Zn and Fe in Glasses Containing Electric Arc Furnace Dust:<br />
a NEXAFS Study<br />
F. Pinakidou, M. Katsikini, A. Mavromati, G. Kaimakamis, Th. Kehagias and E.C. Paloura *<br />
Aristotle University of Thessaloniki, School of Physics, 54124 Thessaloniki, Greece.<br />
*<br />
paloura@auth.gr<br />
1. Introduction<br />
Electric arc furnace dust (EAFD), which is one of the largest solid waste streams produced by steel mills, contains<br />
mainly heavy metals and thus is considered as a toxic waste. Recycling of the valuable metals (Fe, Zn and Pb), which<br />
reduces the disposal problems and results in resource conservation, can recover only a portion of the heavy metals from the<br />
EAFD. Vitrification, leading to the formation of vitreous or glass-ceramic materials, is a promising process to stabilize<br />
metallic Zn and Fe and hence permits the safe disposal of the EAFD [1]. Therefore it is of great importance to study the<br />
bonding geometry of both Fe and Zn in vitrified EAFD-rich industrial wastes, since the structural integrity of the glass matrix<br />
depends strongly on the type of polyhedra that Fe and Zn form.<br />
2. Experimental Details<br />
The studied samples are vitrified products of EAFD (which mainly consists of ZnO<br />
and ferric oxides (ZnFe 2 O 4 )) and are produced by co-melting of the EAFD with SiO 2 ,<br />
Na 2 O and CaO at 1400°C for 2h, followed by quenching. The EAFD concentration<br />
ranges from 10 to 55 wt%, while the SiO 2 concentration is equal to 55 wt% in all<br />
studied samples. The Fe-K and Zn-K-EXAFS measurements were conducted at the<br />
synchrotron radiation facility BESSY in Berlin using the KMC2 beamline. The spectra<br />
were recorded in the fluorescence yield mode using a Si-PIN photodiode. The spectra<br />
from two reference samples, powder hematite (Fe 2 O 3 ) and magnetite (Fe 3 O 4 ), were<br />
recorded in the transmission mode using ionization chambers.<br />
3. Results and discussion<br />
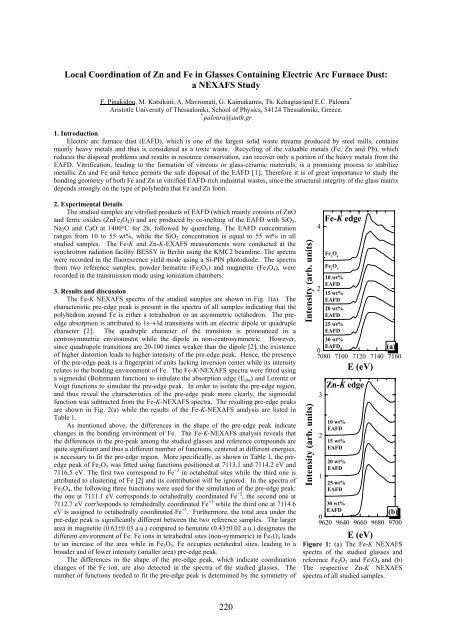
The Fe-K NEXAFS spectra of the studied samples are shown in Fig. 1(a). The<br />
characteristic pre-edge peak is present in the spectra of all samples indicating that the<br />
polyhedron around Fe is either a tetrahedron or an asymmetric octahedron. The preedge<br />
absorption is attributed to 1s→3d transitions with an electric dipole or quadruple<br />
character [2]. The quadruple character of the transition is pronounced in a<br />
centrosymmetric environment while the dipole in non-centrosymmetric. However,<br />
since quadrupole transitions are 20-100 times weaker than the dipole [2], the existence<br />
of higher distortion leads to higher intensity of the pre-edge peak. Hence, the presence<br />
of the pre-edge peak is a fingerprint of units lacking inversion center while its intensity<br />
relates to the bonding environment of Fe. The Fe-K-NEXAFS spectra were fitted using<br />
a sigmoidal (Boltzmann function) to simulate the absorption edge (E abs ) and Lorentz or<br />
Voigt functions to simulate the pre-edge peak. In order to isolate the pre-edge region,<br />
and thus reveal the characteristics of the pre-edge peak more clearly, the sigmoidal<br />
function was subtracted from the Fe-K-NEXAFS spectra. The resulting pre-edge peaks<br />
are shown in Fig. 2(a) while the results of the Fe-K-NEXAFS analysis are listed in<br />
Table 1.<br />
As mentioned above, the differences in the shape of the pre-edge peak indicate<br />
changes in the bonding environment of Fe. The Fe-K-NEXAFS analysis reveals that<br />
the differences in the pre-peak among the studied glasses and reference compounds are<br />
quite significant and thus a different number of functions, centered at different energies,<br />
is necessary to fit the pre-edge region. More specifically, as shown in Table 1, the preedge<br />
peak of Fe 2 O 3 was fitted using functions positioned at 7113.1 and 7114.2 eV and<br />
7116.5 eV. The first two correspond to Fe +3 in octahedral sites while the third one is<br />
attributed to clustering of Fe [2] and its contribution will be ignored. In the spectra of<br />
Fe 3 O 4 , the following three functions were used for the simulation of the pre-edge peak:<br />
the one at 7111.1 eV corresponds to octahedrally coordinated Fe +2 , the second one at<br />
7112.7 eV corr3esponds to tetrahedrally coordinated Fe +3 while the third one at 7114.6<br />
eV is assigned to octahedrally coordinated Fe +3 . Furthermore, the total area under the<br />
pre-edge peak is significantly different between the two reference samples. The larger<br />
area in magnetite (0.63±0.03 a.u.) compared to hematite (0.43±0.02 a.u.) designates the<br />
different environment of Fe: Fe ions in tetrahedral sites (non-symmetric) in Fe 3 O 4 leads<br />
to an increase of the area while in Fe 2 O 3 , Fe occupies octahedral sites, leading to a<br />
broader and of lower intensity (smaller area) pre-edge peak.<br />
The differences in the shape of the pre-edge peak, which indicate coordination<br />
changes of the Fe ion, are also detected in the spectra of the studied glasses. The<br />
number of functions needed to fit the pre-edge peak is determined by the symmetry of<br />
Intensity (arb. units)<br />
Intensity (arb. units)<br />
4<br />
2<br />
Fe-K edge<br />
Fe 3<br />
O 4<br />
Fe 2<br />
O 3<br />
10 wt%<br />
EAFD<br />
15 wt%<br />
EAFD<br />
20 wt%<br />
EAFD<br />
25 wt%<br />
EAFD<br />
30 wt%<br />
EAFD<br />
(a)<br />
0<br />
7080 7100 7120 7140 7160<br />
3<br />
2<br />
1<br />
10 wt%<br />
EAFD<br />
15 wt%<br />
EAFD<br />
20 wt%<br />
EAFD<br />
25 wt%<br />
EAFD<br />
E (eV)<br />
Zn-K edge<br />
30 wt%<br />
EAFD<br />
(b)<br />
0<br />
9620 9640 9660 9680 9700<br />
E (eV)<br />
Figure 1: (a) The Fe-K NEXAFS<br />
spectra of the studied glasses and<br />
reference Fe 2 O 3 and Fe 3 O 4 and (b)<br />
The respective Zn-K NEXAFS<br />
spectra of all studied samples.<br />
220