xxiii Ïανελληνιο ÏÏ Î½ÎµÎ´Ïιο ÏÏ ÏÎ¹ÎºÎ·Ï ÏÏεÏÎµÎ±Ï ÎºÎ±ÏαÏÏαÏÎ·Ï & εÏιÏÏÎ·Î¼Î·Ï ...
xxiii Ïανελληνιο ÏÏ Î½ÎµÎ´Ïιο ÏÏ ÏÎ¹ÎºÎ·Ï ÏÏεÏÎµÎ±Ï ÎºÎ±ÏαÏÏαÏÎ·Ï & εÏιÏÏÎ·Î¼Î·Ï ...
xxiii Ïανελληνιο ÏÏ Î½ÎµÎ´Ïιο ÏÏ ÏÎ¹ÎºÎ·Ï ÏÏεÏÎµÎ±Ï ÎºÎ±ÏαÏÏαÏÎ·Ï & εÏιÏÏÎ·Î¼Î·Ï ...

Create successful ePaper yourself
Turn your PDF publications into a flip-book with our unique Google optimized e-Paper software.
the polyhedron around Fe [2] and in particular when Fe +3 ions occupy tetrahedral sites fitting with one Lerentzian is used.<br />
The Lorentzian is centered ~7113.0 eV, i.e. Fe is trivalent, occupies tetrahedral sites and its valence is independent of the<br />
EAFD glasses concentration<br />
Intensity (arb. units)<br />
0.3<br />
0.2<br />
0.1<br />
10 wt%<br />
EAFD<br />
15 wt%<br />
EAFD<br />
20 wt%<br />
EAFD<br />
25 wt%<br />
EAFD<br />
30 wt%<br />
EAFD<br />
(a)<br />
7108 7110 7112 7114 7116 7118<br />
FeO 6<br />
(at%)<br />
Area (a.u.)<br />
70<br />
60<br />
50<br />
40<br />
30<br />
20<br />
10<br />
0.40<br />
0.38<br />
0.36<br />
0.34<br />
0.32<br />
0.30<br />
0.28<br />
10 15 20 25 30<br />
Energy (eV) EAFD concentration (wt%)<br />
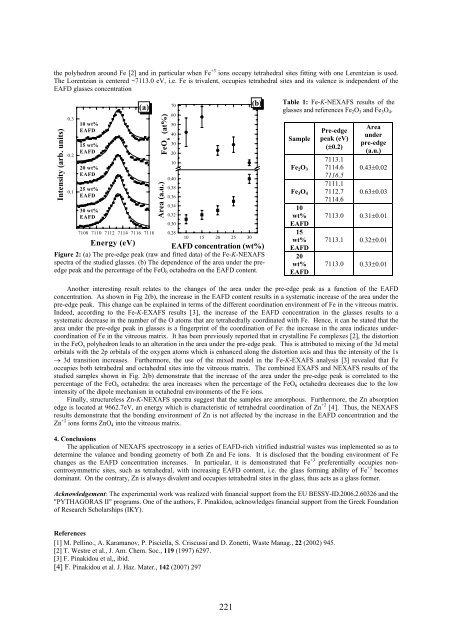
Figure 2: (a) The pre-edge peak (raw and fitted data) of the Fe-K-NEXAFS<br />
spectra of the studied glasses. (b) The dependence of the area under the preedge<br />
peak and the percentage of the FeO 6 octahedra on the EAFD content.<br />
(b)<br />
Table 1: Fe-K-NEXAFS results of the<br />
glasses and references Fe 2 O 3 and Fe 3 O 4 .<br />
Sample<br />
Pre-edge<br />
peak (eV)<br />
(±0.2)<br />
Area<br />
under<br />
pre-edge<br />
(a.u.)<br />
Fe 2 O 3<br />
Fe 3 O 4<br />
7114.6 0.43±0.02<br />
7113.1<br />
7116.5<br />
7112.7 0.63±0.03<br />
7111.1<br />
7114.6<br />
10<br />
wt% 7113.0 0.31±0.01<br />
EAFD<br />
15<br />
wt% 7113.1 0.32±0.01<br />
EAFD<br />
20<br />
wt%<br />
EAFD<br />
7113.0 0.33±0.01<br />
Another interesting result relates to the changes of the area under the pre-edge peak as a function of the EAFD<br />
concentration. As shown in Fig 2(b), the increase in the EAFD content results in a systematic increase of the area under the<br />
pre-edge peak. This change can be explained in terms of the different coordination environment of Fe in the vitreous matrix.<br />
Indeed, according to the Fe-K-EXAFS results [3], the increase of the EAFD concentration in the glasses results to a<br />
systematic decrease in the number of the O atoms that are tetrahedrally coordinated with Fe. Hence, it can be stated that the<br />
area under the pre-edge peak in glasses is a fingerprint of the coordination of Fe: the increase in the area indicates undercoordination<br />
of Fe in the vitreous matrix. It has been previously reported that in crystalline Fe complexes [2], the distortion<br />
in the FeO x polyhedron leads to an alteration in the area under the pre-edge peak. This is attributed to mixing of the 3d metal<br />
orbitals with the 2p orbitals of the oxygen atoms which is enhanced along the distortion axis and thus the intensity of the 1s<br />
→ 3d transition increases. Furthermore, the use of the mixed model in the Fe-K-EXAFS analysis [3] revealed that Fe<br />
occupies both tetrahedral and octahedral sites into the vitreous matrix. The combined EXAFS and NEXAFS results of the<br />
studied samples shown in Fig. 2(b) demonstrate that the increase of the area under the pre-edge peak is correlated to the<br />
percentage of the FeO 6 octahedra: the area increases when the percentage of the FeO 6 octahedra decreases due to the low<br />
intensity of the dipole mechanism in octahedral environments of the Fe ions.<br />
Finally, structureless Zn-K-NEXAFS spectra suggest that the samples are amorphous. Furthermore, the Zn absorption<br />
edge is located at 9662.7eV, an energy which is characteristic of tetrahedral coordination of Zn +2 [4]. Thus, the NEXAFS<br />
results demonstrate that the bonding environment of Zn is not affected by the increase in the EAFD concentration and the<br />
Zn +2 ions forms ZnO 4 into the vitreous matrix.<br />
4. Conclusions<br />
The application of NEXAFS spectroscopy in a series of EAFD-rich vitrified industrial wastes was implemented so as to<br />
determine the valance and bonding geometry of both Zn and Fe ions. It is disclosed that the bonding environment of Fe<br />
changes as the EAFD concentration increases. In particular, it is demonstrated that Fe +3 preferentially occupies noncentrosymmetric<br />
sites, such as tetrahedral, with increasing EAFD content, i.e. the glass forming ability of Fe +3 becomes<br />
dominant. On the contrary, Zn is always divalent and occupies tetrahedral sites in the glass, thus acts as a glass former.<br />
Acknowledgement: The experimental work was realized with financial support from the EU BESSY-ID.2006.2.60326 and the<br />
"PYTHAGORAS II" programs. One of the authors, F. Pinakidou, acknowledges financial support from the Greek Foundation<br />
of Research Scholarships (IKY).<br />
References<br />
[1] M. Pellino., A. Karamanov, P. Pisciella, S. Criscussi and D. Zonetti, Waste Manag., 22 (2002) 945.<br />
[2] T. Westre et al., J. Am. Chem. Soc., 119 (1997) 6297.<br />
[3] F. Pinakidou et al,, ibid.<br />
[4] F. Pinakidou et al. J. Haz. Mater., 142 (2007) 297<br />
221