xxiii Ïανελληνιο ÏÏ Î½ÎµÎ´Ïιο ÏÏ ÏÎ¹ÎºÎ·Ï ÏÏεÏÎµÎ±Ï ÎºÎ±ÏαÏÏαÏÎ·Ï & εÏιÏÏÎ·Î¼Î·Ï ...
xxiii Ïανελληνιο ÏÏ Î½ÎµÎ´Ïιο ÏÏ ÏÎ¹ÎºÎ·Ï ÏÏεÏÎµÎ±Ï ÎºÎ±ÏαÏÏαÏÎ·Ï & εÏιÏÏÎ·Î¼Î·Ï ...
xxiii Ïανελληνιο ÏÏ Î½ÎµÎ´Ïιο ÏÏ ÏÎ¹ÎºÎ·Ï ÏÏεÏÎµÎ±Ï ÎºÎ±ÏαÏÏαÏÎ·Ï & εÏιÏÏÎ·Î¼Î·Ï ...

Create successful ePaper yourself
Turn your PDF publications into a flip-book with our unique Google optimized e-Paper software.
The Structural Role of Fe and Zn in the Formation of Glasses Containing Electric Arc<br />
Furnace Dust: an EXAFS study<br />
F. Pinakidou, M. Katsikini, A. Mavromati, G. Kaimakamis, Th. Kehagias and E.C. Paloura *<br />
Aristotle University of Thessaloniki, School of Physics, 54124 Thessaloniki, Greece.<br />
*<br />
paloura@auth.gr<br />
1. Introduction<br />
The volume of the solid waste that originates from the steel industry increases globally and thus its management must be<br />
efficient and environmentally friendly. Electric arc furnace dust (EAFD) is the largest solid waste stream produced by steel<br />
mills and it comprises mainly of heavy metals which are toxic when disposed to the environment. A simple and cost<br />
effective method used to stabilize these metals is vitrification, which produces vitreous or glass-ceramic materials [1].<br />
Application of this process immobilizes metallic Zn and Fe and thus leads to the formation of safe for disposal EAFD-rich<br />
materials [2]. Since the structural rigidity and hence the chemical stability of the final products is strongly correlated to the<br />
presence of the metals, it is crucial to study the structural role of Fe and Zn, i.e. the type of polyhedra that Fe and Zn<br />
constitute the glassy matrix, in vitrified EAFD-rich industrial wastes.<br />
2. Experimental Details<br />
The studied samples are vitrified materials, produced by co-melting of the EAFD<br />
with SiO 2 , Na 2 O and CaO and casting at 1400 o C. The EAFD mainly consists of ZnO<br />
and ferric oxides (ZnFe 2 O 4 )). The EAFD concentration in the studied glasses<br />
increases with a step of 5 wt% in the range 10 to 30 wt% while the SiO 2 /Na 2 O ratio is<br />
equal to 11, i.e. in all samples the glassy network is a silica matrix. The Fe-K-and Zn-<br />
K-EXAFS measurements were conducted at the synchrotron radiation facility BESSY<br />
in Berlin using the KMC2 beamline. The spectra were recorded in the fluorescence<br />
yield mode using a Si-PIN photodiode.<br />
3. Results and discussion<br />
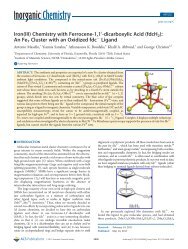
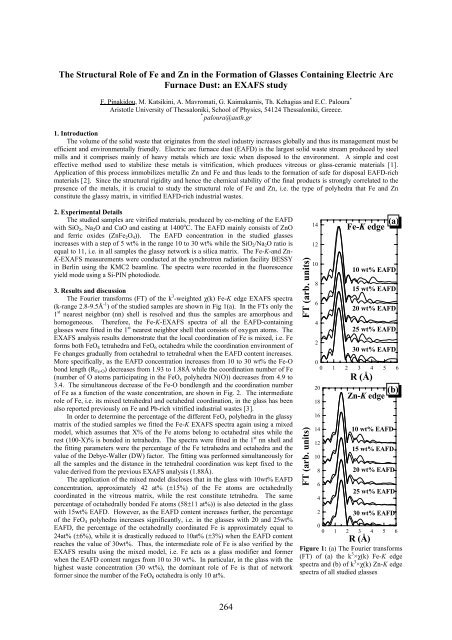
The Fourier transforms (FT) of the k 3 -weighted χ(k) Fe-K edge EXAFS spectra<br />
(k-range 2.8-9.5Å -1 ) of the studied samples are shown in Fig 1(a). In the FTs only the<br />
1 st nearest neighbor (nn) shell is resolved and thus the samples are amorphous and<br />
homogeneous. Therefore, the Fe-K-EXAFS spectra of all the EAFD-containing<br />
glasses were fitted in the 1 st nearest neighbor shell that consists of oxygen atoms. The<br />
EXAFS analysis results demonstrate that the local coordination of Fe is mixed, i.e. Fe<br />
forms both FeO 4 tetrahedra and FeO 6 octahedra while the coordination environment of<br />
Fe changes gradually from octahedral to tetrahedral when the EAFD content increases.<br />
More specifically, as the EAFD concentration increases from 10 to 30 wt% the Fe-O<br />
bond length (R Fe-O ) decreases from 1.93 to 1.88Å while the coordination number of Fe<br />
(number of O atoms participating in the FeO x polyhedra N(O)) decreases from 4.9 to<br />
3.4. The simultaneous decrease of the Fe-O bondlength and the coordination number<br />
of Fe as a function of the waste concentration, are shown in Fig. 2. The intermediate<br />
role of Fe, i.e. its mixed tetrahedral and octahedral coordination, in the glass has been<br />
also reported previously on Fe and Pb-rich vitrified industrial wastes [3].<br />
In order to determine the percentage of the different FeO x polyhedra in the glassy<br />
matrix of the studied samples we fitted the Fe-K EXAFS spectra again using a mixed<br />
model, which assumes that X% of the Fe atoms belong to octahedral sites while the<br />
rest (100-X)% is bonded in tetrahedra. The spectra were fitted in the 1 st nn shell and<br />
the fitting parameters were the percentage of the Fe tetrahedra and octahedra and the<br />
value of the Debye-Waller (DW) factor. The fitting was performed simultaneously for<br />
all the samples and the distance in the tetrahedral coordination was kept fixed to the<br />
value derived from the previous EXAFS analysis (1.88Å).<br />
The application of the mixed model discloses that in the glass with 10wt% EAFD<br />
concentration, approximately 42 at% (±15%) of the Fe atoms are octahedrally<br />
coordinated in the vitreous matrix, while the rest constitute tetrahedra. The same<br />
percentage of octahedrally bonded Fe atoms (58±11 at%)) is also detected in the glass<br />
with 15wt% EAFD. However, as the EAFD content increases further, the percentage<br />
of the FeO 4 polyhedra increases significantly, i.e. in the glasses with 20 and 25wt%<br />
EAFD, the percentage of the octahedrally coordinated Fe is approximately equal to<br />
24at% (±6%), while it is drastically reduced to 10at% (±3%) when the EAFD content<br />
reaches the value of 30wt%. Thus, the intermediate role of Fe is also verified by the<br />
EXAFS results using the mixed model, i.e. Fe acts as a glass modifier and former<br />
when the EAFD content ranges from 10 to 30 wt%. In particular, in the glass with the<br />
highest waste concentration (30 wt%), the dominant role of Fe is that of network<br />
former since the number of the FeO 6 octahedra is only 10 at%.<br />
FT (arb. units)<br />
FT (arb. units)<br />
14<br />
12<br />
10<br />
8<br />
6<br />
4<br />
2<br />
Fe-K edge<br />
(a)<br />
10 wt% EAFD<br />
15 wt% EAFD<br />
20 wt% EAFD<br />
25 wt% EAFD<br />
30 wt% EAFD<br />
0<br />
0 1 2 3 4 5 6<br />
20<br />
18<br />
16<br />
14<br />
12<br />
10<br />
8<br />
6<br />
4<br />
2<br />
R (Å)<br />
(b)<br />
Zn-K edge<br />
10 wt% EAFD<br />
15 wt% EAFD<br />
20 wt% EAFD<br />
25 wt% EAFD<br />
30 wt% EAFD<br />
0<br />
0 1 2 3 4 5 6<br />
R (Å)<br />
Figure 1: (a) The Fourier transforms<br />
(FT) of (a) the k 3 ×χ(k) Fe-K edge<br />
spectra and (b) of k 3 ×χ(k) Zn-K edge<br />
spectra of all studied glasses<br />
264