xxiii Ïανελληνιο ÏÏ Î½ÎµÎ´Ïιο ÏÏ ÏÎ¹ÎºÎ·Ï ÏÏεÏÎµÎ±Ï ÎºÎ±ÏαÏÏαÏÎ·Ï & εÏιÏÏÎ·Î¼Î·Ï ...
xxiii Ïανελληνιο ÏÏ Î½ÎµÎ´Ïιο ÏÏ ÏÎ¹ÎºÎ·Ï ÏÏεÏÎµÎ±Ï ÎºÎ±ÏαÏÏαÏÎ·Ï & εÏιÏÏÎ·Î¼Î·Ï ...
xxiii Ïανελληνιο ÏÏ Î½ÎµÎ´Ïιο ÏÏ ÏÎ¹ÎºÎ·Ï ÏÏεÏÎµÎ±Ï ÎºÎ±ÏαÏÏαÏÎ·Ï & εÏιÏÏÎ·Î¼Î·Ï ...

You also want an ePaper? Increase the reach of your titles
YUMPU automatically turns print PDFs into web optimized ePapers that Google loves.
FIR study of Ag x (As 33 S 33 Se 33 ) 100-X glasses<br />
Th Hasapis (1) , E. Hatzikraniotis (1) , K.M.Paraskevopoulos (1) , K. S. Andrikopoulos (2) , S. N. Yannopoulos (3) , T. Wagner (4)<br />
(1) Solid State Physics, Dept. of Physics, Aristotle University of Thessaloniki<br />
(2) Physics Division, School of Technology, Aristotle University of Thessaloniki<br />
(3) FORTH /ICE-HT, P.O. Box 1414, GR-26504, Rio, Patras<br />
(4) Department of General and Inorganic Chemistry, University of Pardubice, 53210 Pardubice, Czech Republic<br />
Abstract<br />
The structure of chalcogenide glasses Ag x (As 33 S 33 Se 33 ) 100-x with 0≤x≤22 was studied by infrared reflectance spectroscopy. The<br />
absorption coefficient spectra, calculated from reflectance by Kramers-Kroning analysis, were deconvoluted in the frequency<br />
range from 150-450cm -1 with six Gaussian line shape bands and the frequency and relative intensity of the component bands were<br />
determined as a function of silver content. The results were found to be consistent with a glass structure formed by AsSe 3 and<br />
AsS 3 pyramidal units with the silver content to influence mostly the arsenic-selenium component of the glasses, as a strong peak<br />
appears at 252 cm -1 for x=18 glass composition.<br />
Introduction<br />
Chalcogenide glasses have attracted much attention in light of their technological applications, including infrared transmitting<br />
optical elements, xerography, memory switching devices and materials useful for image creation and storage. The chemical<br />
bonding determines the short-range order and consequently many physical properties. Infrared spectroscopy is a technique<br />
sensitive to changes at the atomic level and therefore is a powerful tool for structure detection.<br />
The major features of the vibrational spectra of As 2 S 3 and As 2 Se 3 stoichiometric glasses are determined by vibrations of<br />
AsS 3 and AsSe 3 pyrmamidal units, respectively which are interconnected through As-S(Se)-As bridges [1,2,3]. This model can be<br />
extended also in the case of ternary systems As x S y Se z with the resultant spectrum being a superposition of the spectra of the<br />
constituent units [4], which are determined by the y/z ratio in the glass.Raman spectra of As 33 S 67-x Se x and Ag x (As 0.33 S 0.67-y Se y ) 100-x<br />
amorphous films showed contributions from different structural units as pyramids AsS(Se) 3 , Se-rings, S-chains and As 3 S(Se) 6<br />
units connected by S(Se)-Ag-S(Se) linkages with a decrease in S-S or Se-Se bonds respectively [5,6].<br />
In this work we present infrared reflectivity spectra of Ag x (As 33 S 33 Se 33 ) 100-x glasses in order to study the effect of silver<br />
doping on the structure of the non-stoichiometric glass matrix (As 33 S 33 Se 33 ) since the knowledge of optical properties of<br />
amorphous bulk or thin films of Ag-As-S-Se is important for potential applications.<br />
Experimental<br />
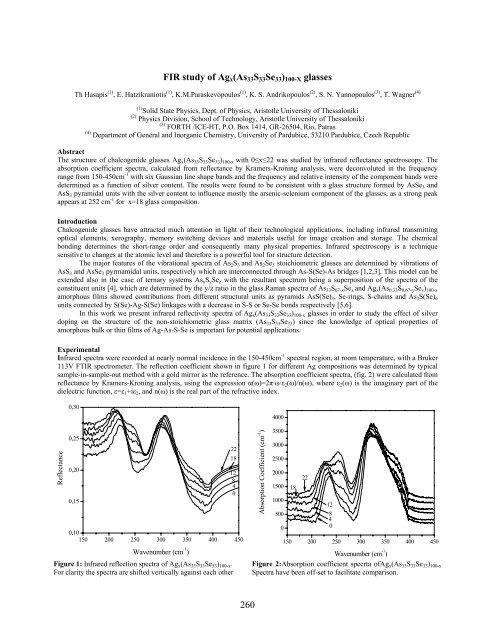
Infrared spectra were recorded at nearly normal incidence in the 150-450cm -1 spectral region, at room temperature, with a Bruker<br />
113V FTIR spectrometer. The reflection coefficient shown in figure 1 for different Ag compositions was determined by typical<br />
sample-in-sample-out method with a gold mirror as the reference. The absorption coefficient spectra, (fig. 2) were calculated from<br />
reflectance by Kramers-Kroning analysis, using the expression α(ω)=2π·ω·ε 2 (ω)/n(ω), where ε 2 (ω) is the imaginary part of the<br />
dielectric function, ε=ε 1 +iε 2 , and n(ω) is the real part of the refractive index.<br />
Reflectance<br />
0,30<br />
0,25<br />
0,20<br />
0,15<br />
0,10<br />
150 200 250 300 350 400 450<br />
Wavenumber (cm -1 )<br />
Figure 1: Infrared reflection spectra of Ag x (As 33 S 33 Se 33 ) 100-x .<br />
For clarity the spectra are shifted vertically against each other<br />
22<br />
18<br />
12<br />
8<br />
4<br />
0<br />
Absorption Coefficient (cm -1 )<br />
4000<br />
3500<br />
3000<br />
2500<br />
2000<br />
1500<br />
1000<br />
500<br />
0<br />
18<br />
22<br />
12<br />
4 8<br />
0<br />
150 200 250 300 350 400 450<br />
Wavenumber (cm -1 )<br />
Figure 2:Absorption coefficient specrta ofAg x (As 33 S 33 Se 33 ) 100-x<br />
Spectra have been off-set to facilitate comparison.<br />
260