xxiii Ïανελληνιο ÏÏ Î½ÎµÎ´Ïιο ÏÏ ÏÎ¹ÎºÎ·Ï ÏÏεÏÎµÎ±Ï ÎºÎ±ÏαÏÏαÏÎ·Ï & εÏιÏÏÎ·Î¼Î·Ï ...
xxiii Ïανελληνιο ÏÏ Î½ÎµÎ´Ïιο ÏÏ ÏÎ¹ÎºÎ·Ï ÏÏεÏÎµÎ±Ï ÎºÎ±ÏαÏÏαÏÎ·Ï & εÏιÏÏÎ·Î¼Î·Ï ...
xxiii Ïανελληνιο ÏÏ Î½ÎµÎ´Ïιο ÏÏ ÏÎ¹ÎºÎ·Ï ÏÏεÏÎµÎ±Ï ÎºÎ±ÏαÏÏαÏÎ·Ï & εÏιÏÏÎ·Î¼Î·Ï ...

Create successful ePaper yourself
Turn your PDF publications into a flip-book with our unique Google optimized e-Paper software.
x=18<br />
x=18<br />
Infrared Absorption<br />
x=12<br />
Infrared Absorption<br />
x=12<br />
x=0<br />
x=0<br />
200 210 220 230 240 250 260 270 280<br />
Wavenumber (cm -1 )<br />
280 300 320 340 360 380 400<br />
Wavenumber (cm -1 )<br />
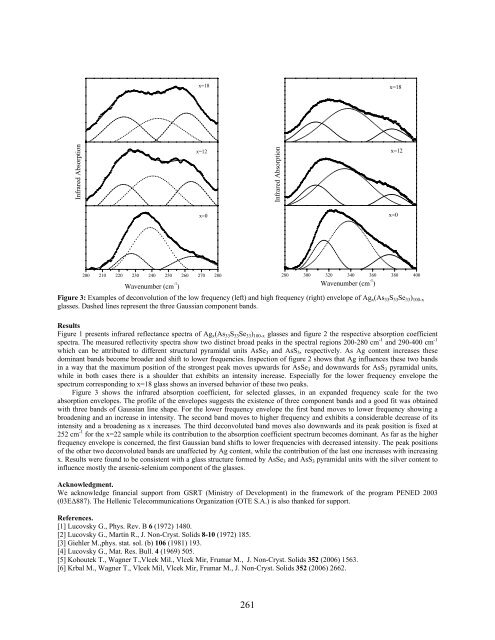
Figure 3: Examples of deconvolution of the low frequency (left) and high frequency (right) envelope of Ag x (As 33 S 33 Se 33 ) 100-x<br />
glasses. Dashed lines represent the three Gaussian component bands.<br />
Results<br />
Figure 1 presents infrared reflectance spectra of Ag x (As 33 S 33 Se 33 ) 100-x glasses and figure 2 the respective absorption coefficient<br />
spectra. The measured reflectivity spectra show two distinct broad peaks in the spectral regions 200-280 cm -1 and 290-400 cm -1<br />
which can be attributed to different structural pyramidal units AsSe 3 and AsS 3 , respectively. As Ag content increases these<br />
dominant bands become broader and shift to lower frequencies. Inspection of figure 2 shows that Ag influences these two bands<br />
in a way that the maximum position of the strongest peak moves upwards for AsSe 3 and downwards for AsS 3 pyramidal units,<br />
while in both cases there is a shoulder that exhibits an intensity increase. Especially for the lower frequency envelope the<br />
spectrum corresponding to x=18 glass shows an inversed behavior of these two peaks.<br />
Figure 3 shows the infrared absorption coefficient, for selected glasses, in an expanded frequency scale for the two<br />
absorption envelopes. The profile of the envelopes suggests the existence of three component bands and a good fit was obtained<br />
with three bands of Gaussian line shape. For the lower frequency envelope the first band moves to lower frequency showing a<br />
broadening and an increase in intensity. The second band moves to higher frequency and exhibits a considerable decrease of its<br />
intensity and a broadening as x increases. The third deconvoluted band moves also downwards and its peak position is fixed at<br />
252 cm -1 for the x=22 sample while its contribution to the absorption coefficient spectrum becomes dominant. As far as the higher<br />
frequency envelope is concerned, the first Gaussian band shifts to lower frequencies with decreased intensity. The peak positions<br />
of the other two deconvoluted bands are unaffected by Ag content, while the contribution of the last one increases with increasing<br />
x. Results were found to be consistent with a glass structure formed by AsSe 3 and AsS 3 pyramidal units with the silver content to<br />
influence mostly the arsenic-selenium component of the glasses.<br />
Acknowledgment.<br />
We acknowledge financial support from GSRT (Ministry of Development) in the framework of the program PENED 2003<br />
(03ΕΔ887). The Hellenic Telecommunications Organization (OTE S.A.) is also thanked for support.<br />
References.<br />
[1] Lucovsky G., Phys. Rev. B 6 (1972) 1480.<br />
[2] Lucovsky G., Martin R., J. Non-Cryst. Solids 8-10 (1972) 185.<br />
[3] Giehler M.,phys. stat. sol. (b) 106 (1981) 193.<br />
[4] Lucovsky G., Mat. Res. Bull. 4 (1969) 505.<br />
[5] Kohoutek T., Wagner T.,Vlcek Mil., Vlcek Mir, Frumar M., J. Non-Cryst. Solids 352 (2006) 1563.<br />
[6] Krbal M., Wagner T., Vlcek Mil, Vlcek Mir, Frumar M., J. Non-Cryst. Solids 352 (2006) 2662.<br />
261