- Page 1 and 2:
AN EVALUATION OF PERFORMANCEIMPROVE
- Page 3 and 4:
Finally, but of course not last, is
- Page 5 and 6:
CONTENTSChapter 1INTRODUCTION AND C
- Page 7 and 8:
3.21 From linear performance toward
- Page 9 and 10:
7.9 Critical success factors and pr
- Page 11 and 12:
9.13 Use of factor analysis for soc
- Page 13 and 14:
LIST OFFIGURESFigure 1.1 Timeline o
- Page 15 and 16:
Figure 9.8Figure 9.9Figure 9.10Boxp
- Page 17 and 18:
Table 7.10 Project characteristics
- Page 19 and 20:
LIST OFAPPENDICESAppendix 1The link
- Page 21 and 22:
Thesis Keith Gale 2013CHAPTER 1: IN
- Page 23 and 24:
Thesis Keith Gale 2013All suppliers
- Page 25 and 26:
Thesis Keith Gale 2013non-European
- Page 27 and 28:
Thesis Keith Gale 20131.2.7 Geared
- Page 29 and 30:
Thesis Keith Gale 20131.4 Aim and O
- Page 31 and 32:
Thesis Keith Gale 2013Current profe
- Page 33 and 34:
Thesis Keith Gale 2013In order to r
- Page 35 and 36:
Thesis Keith Gale 2013accepting the
- Page 37 and 38:
Thesis Keith Gale 2013Timeline of S
- Page 39 and 40:
Thesis Keith Gale 2013approach towa
- Page 41 and 42:
Thesis Keith Gale 2013spending prof
- Page 43 and 44:
Thesis Keith Gale 2013School, 2008)
- Page 45 and 46:
Thesis Keith Gale 20131.11 From ben
- Page 47 and 48:
Thesis Keith Gale 2013select lists.
- Page 49 and 50:
Thesis Keith Gale 2013positioning i
- Page 51 and 52:
Thesis Keith Gale 2013CHAPTER 2: IM
- Page 53 and 54:
Thesis Keith Gale 2013competition i
- Page 55 and 56:
Thesis Keith Gale 2013systems (for
- Page 57 and 58:
Thesis Keith Gale 2013and services
- Page 59 and 60:
Thesis Keith Gale 2013recognition o
- Page 61 and 62:
Thesis Keith Gale 2013individual pr
- Page 63 and 64:
Thesis Keith Gale 2013continuity of
- Page 65 and 66:
Thesis Keith Gale 2013Table 2.1: Al
- Page 67 and 68:
Thesis Keith Gale 20132.8 SummaryAt
- Page 69 and 70:
Thesis Keith Gale 2013CHAPTER 3: LI
- Page 71 and 72:
Thesis Keith Gale 2013The procureme
- Page 73 and 74:
Thesis Keith Gale 2013• A ‘cogn
- Page 75 and 76:
Thesis Keith Gale 2013beliefs and c
- Page 77 and 78:
Thesis Keith Gale 2013Table 3.1: Te
- Page 79 and 80:
Thesis Keith Gale 2013and affect sa
- Page 81 and 82:
Thesis Keith Gale 2013Aside from so
- Page 83 and 84:
Thesis Keith Gale 2013coupled with
- Page 85 and 86:
Thesis Keith Gale 2013precious ston
- Page 87 and 88:
Thesis Keith Gale 2013methods incre
- Page 89 and 90:
Thesis Keith Gale 2013procurement,
- Page 91 and 92:
Thesis Keith Gale 2013tender list c
- Page 93 and 94:
Thesis Keith Gale 2013success facto
- Page 95 and 96:
Thesis Keith Gale 20131998). The mo
- Page 97 and 98:
Thesis Keith Gale 2013Relationships
- Page 99 and 100:
Thesis Keith Gale 2013CHAPTER 4: HY
- Page 101 and 102:
Thesis Keith Gale 2013Recognitions
- Page 103 and 104:
Thesis Keith Gale 2013H2: Framework
- Page 105 and 106:
Thesis Keith Gale 2013Group C: Iden
- Page 107 and 108:
Thesis Keith Gale 2013collection of
- Page 109 and 110:
Thesis Keith Gale 20134.7.4 Interac
- Page 111 and 112:
Thesis Keith Gale 2013Within constr
- Page 113 and 114:
Thesis Keith Gale 2013• Static me
- Page 115 and 116:
Thesis Keith Gale 2013performance d
- Page 117 and 118:
Thesis Keith Gale 2013Theory andpra
- Page 119 and 120:
Thesis Keith Gale 2013productioncos
- Page 121 and 122:
Thesis Keith Gale 2013Providing a l
- Page 123 and 124:
Thesis Keith Gale 2013and became a
- Page 125 and 126:
Thesis Keith Gale 2013that intimate
- Page 127 and 128:
Thesis Keith Gale 20135.5 Case stud
- Page 129 and 130:
Thesis Keith Gale 20135.5.6 Alignme
- Page 131 and 132:
Thesis Keith Gale 2013Table 5.2: Ex
- Page 133 and 134:
Thesis Keith Gale 2013An investigat
- Page 135 and 136:
Thesis Keith Gale 2013Figure 5.3: M
- Page 137 and 138:
Thesis Keith Gale 2013organisation.
- Page 139 and 140:
Thesis Keith Gale 2013CHAPTER 6: DA
- Page 141 and 142:
Thesis Keith Gale 2013until August
- Page 143 and 144:
Thesis Keith Gale 2013quarterly per
- Page 145 and 146:
Thesis Keith Gale 2013professional
- Page 147 and 148:
Thesis Keith Gale 2013Table 7.3: te
- Page 149 and 150:
Thesis Keith Gale 2013Section 3 of
- Page 151 and 152:
Thesis Keith Gale 2013proportionall
- Page 153 and 154:
Thesis Keith Gale 2013right of the
- Page 155 and 156:
Thesis Keith Gale 2013Figure 7.5: S
- Page 157 and 158:
Thesis Keith Gale 20137.8 Detailed
- Page 159 and 160:
Thesis Keith Gale 2013(Audit Commis
- Page 161 and 162:
Thesis Keith Gale 2013From this inf
- Page 163 and 164:
Thesis Keith Gale 2013Agreed works
- Page 165 and 166:
Thesis Keith Gale 2013The percentag
- Page 167 and 168:
Thesis Keith Gale 20137.12 Analysis
- Page 169 and 170:
Thesis Keith Gale 2013Table 7.10: P
- Page 171 and 172:
Thesis Keith Gale 2013Independent s
- Page 173 and 174:
Thesis Keith Gale 20137.15 Interpre
- Page 175 and 176:
Thesis Keith Gale 20137.15.4 Interp
- Page 177 and 178:
Thesis Keith Gale 2013independent v
- Page 179 and 180: Thesis Keith Gale 20137.17 Interpre
- Page 181 and 182: Thesis Keith Gale 2013difference in
- Page 183 and 184: Thesis Keith Gale 2013contract valu
- Page 185 and 186: Thesis Keith Gale 2013H1 proposes t
- Page 187 and 188: Thesis Keith Gale 2013CHAPTER 8: FI
- Page 189 and 190: Thesis Keith Gale 2013of variances
- Page 191 and 192: Thesis Keith Gale 20138.4 Compariso
- Page 193 and 194: Thesis Keith Gale 2013• Feasibili
- Page 195 and 196: Thesis Keith Gale 20138.7 Analysis
- Page 197 and 198: Thesis Keith Gale 2013In order to s
- Page 199 and 200: Thesis Keith Gale 2013and 1 to repr
- Page 201 and 202: Thesis Keith Gale 2013costs could b
- Page 203 and 204: Thesis Keith Gale 2013to an alterna
- Page 205 and 206: Thesis Keith Gale 2013Figure 8.3: T
- Page 207 and 208: Thesis Keith Gale 2013Table 8.5: Gr
- Page 209 and 210: Thesis Keith Gale 20138.16 Action r
- Page 211 and 212: Thesis Keith Gale 2013the action re
- Page 213 and 214: Thesis Keith Gale 2013supplier). A
- Page 215 and 216: Thesis Keith Gale 20139.2 Questionn
- Page 217 and 218: Thesis Keith Gale 20139.4 Sociologi
- Page 219 and 220: Thesis Keith Gale 2013A review of r
- Page 221 and 222: Thesis Keith Gale 2013Table 9.5: St
- Page 223 and 224: Thesis Keith Gale 2013points in the
- Page 225 and 226: Thesis Keith Gale 20139.9.1 Views c
- Page 227 and 228: Thesis Keith Gale 20139.9.3 Views c
- Page 229: Thesis Keith Gale 20135% Trimmed Me
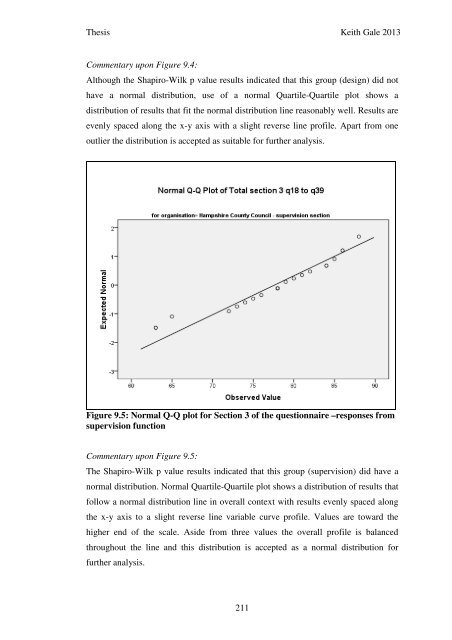
- Page 233 and 234: Thesis Keith Gale 2013Figure 9.7: N
- Page 235 and 236: Thesis Keith Gale 20139.11 Identifi
- Page 237 and 238: Thesis Keith Gale 20139.11.1 Views
- Page 239 and 240: Thesis Keith Gale 20139.11.3 Views
- Page 241 and 242: Thesis Keith Gale 2013and meaningfu
- Page 243 and 244: Thesis Keith Gale 2013Figure 9.12:
- Page 245 and 246: Thesis Keith Gale 2013Table 9.15: R
- Page 247 and 248: Thesis Keith Gale 20139.17 Summary
- Page 249 and 250: Thesis Keith Gale 2013qualification
- Page 251 and 252: Thesis Keith Gale 2013include hesit
- Page 253 and 254: Thesis Keith Gale 2013Table 10.1: S
- Page 255 and 256: Thesis Keith Gale 2013• Filtering
- Page 257 and 258: Thesis Keith Gale 2013Figure 10.3:
- Page 259 and 260: Thesis Keith Gale 201310.6.4 Themat
- Page 261 and 262: Thesis Keith Gale 201310.6.5 Themat
- Page 263 and 264: Thesis Keith Gale 201310.7 Qualitat
- Page 265 and 266: Thesis Keith Gale 2013frameworks -
- Page 267 and 268: Thesis Keith Gale 2013Support for l
- Page 269 and 270: Thesis Keith Gale 2013‘I think th
- Page 271 and 272: Thesis Keith Gale 2013Within the ge
- Page 273 and 274: Thesis Keith Gale 2013Construct val
- Page 275 and 276: Thesis Keith Gale 2013in this chapt
- Page 277 and 278: Thesis Keith Gale 2013• the hypot
- Page 279 and 280: Thesis Keith Gale 201311.4 Validati
- Page 281 and 282:
Thesis Keith Gale 201311.5 Validati
- Page 283 and 284:
Thesis Keith Gale 201311.5.4 Induct
- Page 285 and 286:
Thesis Keith Gale 2013Table 11.2: S
- Page 287 and 288:
Thesis Keith Gale 2013‘…you’v
- Page 289 and 290:
Thesis Keith Gale 2013are consisten
- Page 291 and 292:
Thesis Keith Gale 201311.9 Sharing
- Page 293 and 294:
Thesis Keith Gale 2013CHAPTER 12: C
- Page 295 and 296:
Thesis Keith Gale 2013that integrat
- Page 297 and 298:
Thesis Keith Gale 2013took the oppo
- Page 299 and 300:
Thesis Keith Gale 2013The impact of
- Page 301 and 302:
Thesis Keith Gale 201312.5.3 Releva
- Page 303 and 304:
Thesis Keith Gale 201312.5.4 Releva
- Page 305 and 306:
Thesis Keith Gale 2013environment,
- Page 307 and 308:
Thesis Keith Gale 2013Confidence wi
- Page 309 and 310:
Thesis Keith Gale 2013Ankrah, N. A.
- Page 311 and 312:
Thesis Keith Gale 2013Bogdan, R.C.
- Page 313 and 314:
Thesis Keith Gale 2013Carr, R.I. (1
- Page 315 and 316:
Thesis Keith Gale 2013Cresswell, J.
- Page 317 and 318:
Thesis Keith Gale 2013Drexler, J.A.
- Page 319 and 320:
Thesis Keith Gale 2013Flyvbjerg, B.
- Page 321 and 322:
Thesis Keith Gale 2013Greenhalgh, T
- Page 323 and 324:
Thesis Keith Gale 2013Hoxley, M. (2
- Page 325 and 326:
Thesis Keith Gale 2013Kvale, S. (19
- Page 327 and 328:
Thesis Keith Gale 2013Loosemore, M.
- Page 329 and 330:
Thesis Keith Gale 2013Mohamed, S. (
- Page 331 and 332:
Thesis Keith Gale 2013OED (2007). S
- Page 333 and 334:
Thesis Keith Gale 2013Punch, K.F. (
- Page 335 and 336:
Thesis Keith Gale 2013Runeson, G.R.
- Page 337 and 338:
Thesis Keith Gale 2013Tourangeau, R
- Page 339 and 340:
Appendices to Thesis Keith Gale 201
- Page 341 and 342:
Appendices to Thesis Keith Gale 201
- Page 343 and 344:
Appendices to Thesis Keith Gale 201
- Page 345 and 346:
Appendices to Thesis Keith Gale 201
- Page 347 and 348:
Appendices to Thesis Keith Gale 201
- Page 349 and 350:
Appendices to Thesis Keith Gale 201
- Page 351 and 352:
Appendices to Thesis Keith Gale 201
- Page 353 and 354:
Appendices to Thesis Keith Gale 201
- Page 355 and 356:
Appendices to Thesis Keith Gale 201
- Page 357 and 358:
Appendices to Thesis Keith Gale 201
- Page 359 and 360:
Appendices to Thesis Keith Gale 201
- Page 361 and 362:
Appendices to Thesis Keith Gale 201
- Page 363 and 364:
Appendices to Thesis Keith Gale 201
- Page 365 and 366:
Appendices to Thesis Keith Gale 201
- Page 367 and 368:
Appendices to Thesis Keith Gale 201
- Page 369 and 370:
Appendices to Thesis Keith Gale 201
- Page 371 and 372:
Appendices to Thesis Keith Gale 201
- Page 373 and 374:
Appendices to Thesis Keith Gale 201
- Page 375 and 376:
Appendices to Thesis Keith Gale 201
- Page 377 and 378:
Appendices to Thesis Keith Gale 201
- Page 379 and 380:
Appendices to Thesis Keith Gale 201
- Page 381 and 382:
Appendices to Thesis Keith Gale 201
- Page 383 and 384:
Appendices to Thesis Keith Gale 201
- Page 385 and 386:
Appendices to Thesis Keith Gale 201
- Page 387 and 388:
Appendices to Thesis Keith Gale 201
- Page 389 and 390:
Appendices to Thesis Keith Gale 201
- Page 391 and 392:
Appendices to Thesis Keith Gale 201
- Page 393 and 394:
Appendices to Thesis Keith Gale 201
- Page 395 and 396:
Appendices to Thesis Keith Gale 201
- Page 397 and 398:
Appendices to Thesis Keith Gale 201
- Page 399 and 400:
Appendices to Thesis Keith Gale 201
- Page 401 and 402:
Appendices to Thesis Keith Gale 201
- Page 403 and 404:
Appendices to Thesis Keith Gale 201
- Page 405 and 406:
Appendices to Thesis Keith Gale 201
- Page 407 and 408:
Appendices to Thesis Keith Gale 201
- Page 409 and 410:
Appendices to Thesis Keith Gale 201
- Page 411 and 412:
Appendices to Thesis Keith Gale 201
- Page 413 and 414:
Appendices to Thesis Keith Gale 201
- Page 415 and 416:
Appendices to Thesis Keith Gale 201
- Page 417 and 418:
Appendices to Thesis Keith Gale 201
- Page 419 and 420:
Appendices to Thesis Keith Gale 201
- Page 421 and 422:
Appendices to Thesis Keith Gale 201
- Page 423 and 424:
Appendices to Thesis Keith Gale 201
- Page 425 and 426:
Appendices to Thesis Keith Gale 201
- Page 427 and 428:
Appendices to Thesis Keith Gale 201
- Page 429 and 430:
Appendices to Thesis Keith Gale 201
- Page 431 and 432:
Appendices to Thesis Keith Gale 201
- Page 433 and 434:
Appendices to Thesis Keith Gale 201
- Page 435 and 436:
Appendices to Thesis Keith Gale 201
- Page 437 and 438:
Appendices to Thesis Keith Gale 201
- Page 439 and 440:
Appendices to Thesis Keith Gale 201
- Page 441 and 442:
Appendices to Thesis Keith Gale 201
- Page 443 and 444:
Appendices to Thesis Keith Gale 201
- Page 445 and 446:
Appendices to Thesis Keith Gale 201
- Page 447 and 448:
Appendices to Thesis Keith Gale 201
- Page 449 and 450:
Appendices to Thesis Keith Gale 201
- Page 451 and 452:
Appendices to Thesis Keith Gale 201
- Page 453 and 454:
Appendices to Thesis Keith Gale 201
- Page 455 and 456:
Appendices to Thesis Keith Gale 201
- Page 457 and 458:
Appendices to Thesis Keith Gale 201
- Page 459 and 460:
Appendices to Thesis Keith Gale 201
- Page 461 and 462:
Appendices to Thesis Keith Gale 201
- Page 463 and 464:
Appendices to Thesis Keith Gale 201
- Page 465 and 466:
Appendices to Thesis Keith Gale 201
- Page 467 and 468:
Appendices to Thesis Keith Gale 201
- Page 469 and 470:
Appendices to Thesis Keith Gale 201
- Page 471 and 472:
Appendices to Thesis Keith Gale 201
- Page 473 and 474:
Appendices to Thesis Keith Gale 201
- Page 475:
Appendices to Thesis Keith Gale 201