Noelia Cáceres Sánchez TESIS DOCTORAL - Universidad de Sevilla
Noelia Cáceres Sánchez TESIS DOCTORAL - Universidad de Sevilla
Noelia Cáceres Sánchez TESIS DOCTORAL - Universidad de Sevilla

You also want an ePaper? Increase the reach of your titles
YUMPU automatically turns print PDFs into web optimized ePapers that Google loves.
Capítulo 4: INFERENCIA DE VOLÚMENES DE TRÁFICO MEDIANTE LA TELEFONÍA MÓVIL 99<br />
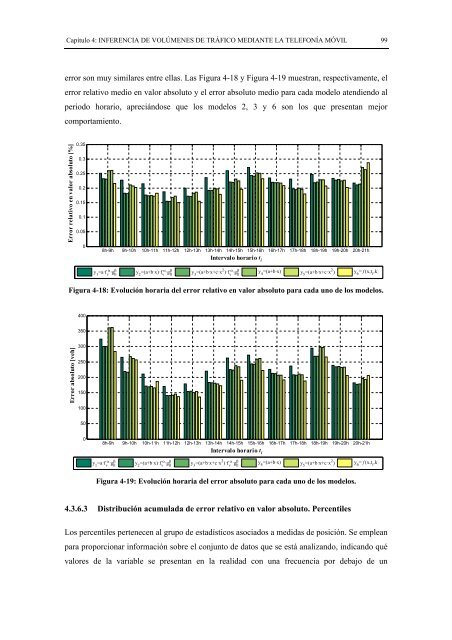
error son muy similares entre ellas. Las Figura 4-18 y Figura 4-19 muestran, respectivamente, el<br />
error relativo medio en valor absoluto y el error absoluto medio para cada mo<strong>de</strong>lo atendiendo al<br />
periodo horario, apreciándose que los mo<strong>de</strong>los 2, 3 y 6 son los que presentan mejor<br />
comportamiento.<br />
Error relativo en valor absoluto [%]<br />
0.35<br />
0.3<br />
0.25<br />
0.2<br />
0.15<br />
0.1<br />
0.05<br />
0<br />
8h-9h 9h-10h 10h-11h 11h-12h 12h-13h 13h-14h 14h-15h 15h-16h 16h-17h 17h-18h 18h-19h 19h-20h 20h-21h<br />
Intervalo horario ti y1 =a·f �<br />
v<br />
·gll<br />
� y2 =(a+b·x)·f �<br />
v<br />
·gll<br />
� y3 =(a+b·x+c·x 2 )·f �<br />
v<br />
·gll<br />
� y4 =(a+b·x) y5 =(a+b·x+c·x 2 ) y6 = f (x,ti ,k))<br />
Figura 4-18: Evolución horaria <strong>de</strong>l error relativo en valor absoluto para cada uno <strong>de</strong> los mo<strong>de</strong>los.<br />
Error absoluto [veh]<br />
400<br />
350<br />
300<br />
250<br />
200<br />
150<br />
100<br />
50<br />
0<br />
8h-9h 9h-10h 10h-11h 11h-12h 12h-13h 13h-14h 14h-15h 15h-16h 16h-17h 17h-18h 18h-19h 19h-20h 20h-21h<br />
Intervalo horario ti y1 =a·f �<br />
v<br />
·gll<br />
� y2 =(a+b·x)·f �<br />
v<br />
·gll<br />
� y3 =(a+b·x+c·x 2 )·f �<br />
v<br />
·gll<br />
� y4 =(a+b·x) y5 =(a+b·x+c·x 2 ) y6 = f (x,ti ,k))<br />
Figura 4-19: Evolución horaria <strong>de</strong>l error absoluto para cada uno <strong>de</strong> los mo<strong>de</strong>los.<br />
4.3.6.3 Distribución acumulada <strong>de</strong> error relativo en valor absoluto. Percentiles<br />
Los percentiles pertenecen al grupo <strong>de</strong> estadísticos asociados a medidas <strong>de</strong> posición. Se emplean<br />
para proporcionar información sobre el conjunto <strong>de</strong> datos que se está analizando, indicando qué<br />
valores <strong>de</strong> la variable se presentan en la realidad con una frecuencia por <strong>de</strong>bajo <strong>de</strong> un