Prospetto di composizione del portafoglio titoli e altre
Prospetto di composizione del portafoglio titoli e altre
Prospetto di composizione del portafoglio titoli e altre
Create successful ePaper yourself
Turn your PDF publications into a flip-book with our unique Google optimized e-Paper software.
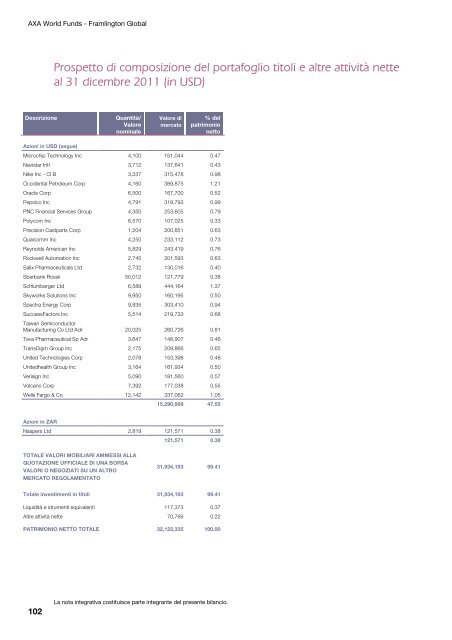
AXA World Funds - Framlington Global<br />
102<br />
<strong>Prospetto</strong> <strong>di</strong> <strong>composizione</strong> <strong>del</strong> <strong>portafoglio</strong> <strong>titoli</strong> e <strong>altre</strong> attività nette<br />
al 31 <strong>di</strong>cembre 2011 (in USD)<br />
Descrizione Quantità/<br />
Valore<br />
nominale<br />
Azioni in USD (segue)<br />
Valore <strong>di</strong><br />
mercato<br />
% <strong>del</strong><br />
patrimonio<br />
netto<br />
Microchip Technology Inc 4,100 151,044 0.47<br />
Navistar Intl 3,712 137,641 0.43<br />
Nike Inc - Cl B 3,237 315,478 0.98<br />
Occidental Petroleum Corp 4,160 389,875 1.21<br />
Oracle Corp 6,500 167,700 0.52<br />
Pepsico Inc 4,791 318,793 0.99<br />
PNC Financial Services Group 4,350 253,605 0.79<br />
Polycom Inc 6,570 107,025 0.33<br />
Precision Castparts Corp 1,204 200,851 0.63<br />
Qualcomm Inc 4,250 233,112 0.73<br />
Reynolds American Inc 5,829 243,419 0.76<br />
Rockwell Automation Inc 2,745 201,593 0.63<br />
Salix Pharmaceuticals Ltd 2,732 130,016 0.40<br />
Sberbank Rossii 50,012 121,779 0.38<br />
Schlumberger Ltd 6,589 444,164 1.37<br />
Skyworks Solutions Inc 9,950 160,195 0.50<br />
Spectra Energy Corp 9,835 303,410 0.94<br />
SuccessFactors Inc<br />
Taiwan Semiconductor<br />
5,514 219,733 0.68<br />
Manufacturing Co Ltd Adr 20,025 260,726 0.81<br />
Teva Pharmaceutical Sp Adr 3,647 148,907 0.46<br />
TransDigm Group Inc 2,175 209,866 0.65<br />
United Technologies Corp 2,078 153,398 0.48<br />
Unitedhealth Group Inc 3,164 161,934 0.50<br />
Verisign Inc 5,090 181,560 0.57<br />
Volcano Corp 7,392 177,038 0.55<br />
Wells Fargo & Co 12,142 337,062 1.05<br />
15,290,999 47.55<br />
Azioni in ZAR<br />
Naspers Ltd 2,819 121,571 0.38<br />
121,571 0.38<br />
TOTALE VALORI MOBILIARI AMMESSI ALLA<br />
QUOTAZIONE UFFICIALE DI UNA BORSA<br />
VALORI O NEGOZIATI SU UN ALTRO<br />
MERCATO REGOLAMENTATO<br />
31,934,193 99.41<br />
Totale investimenti in <strong>titoli</strong> 31,934,193 99.41<br />
Liqui<strong>di</strong>tà e strumenti equivalenti 117,373 0.37<br />
Altre attività nette 70,769 0.22<br />
PATRIMONIO NETTO TOTALE 32,122,335 100.00<br />
La nota integrativa costituisce parte integrante <strong>del</strong> presente bilancio.


