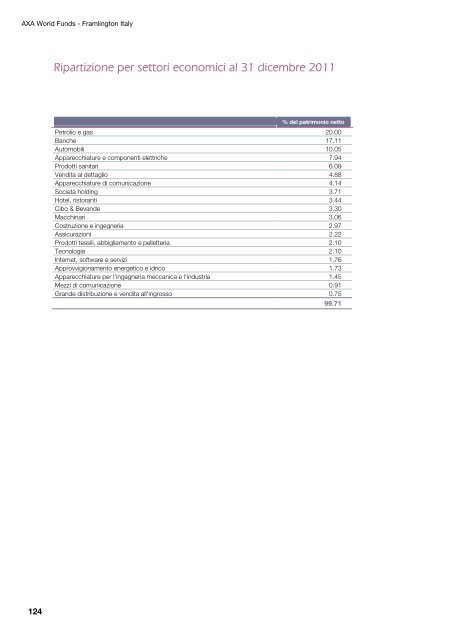
AXA World Funds - Framlington Italy 124 Ripartizione per settori economici al 31 <strong>di</strong>cembre 2011 % <strong>del</strong> patrimonio netto Petrolio e gas 20.00 Banche 17.11 Automobili 10.05 Apparecchiature e componenti elettriche 7.94 Prodotti sanitari 6.09 Ven<strong>di</strong>ta al dettaglio 4.88 Apparecchiature <strong>di</strong> comunicazione 4.14 Società hol<strong>di</strong>ng 3.71 Hotel, ristoranti 3.44 Cibo & Bevande 3.30 Macchinari 3.06 Costruzione e ingegneria 2.97 Assicurazioni 2.22 Prodotti tessili, abbigliamento e pelletteria 2.10 Tecnologia 2.10 Internet, software e servizi 1.76 Approvvigionamento energetico e idrico 1.73 Apparecchiature per l'ingegneria meccanica e l'industria 1.45 Mezzi <strong>di</strong> comunicazione 0.91 Grande <strong>di</strong>stribuzione e ven<strong>di</strong>ta all'ingrosso 0.75 99.71
AXA World Funds - Framlington Junior Energy <strong>Prospetto</strong> <strong>di</strong> <strong>composizione</strong> <strong>del</strong> <strong>portafoglio</strong> <strong>titoli</strong> e <strong>altre</strong> attività nette al 31 <strong>di</strong>cembre 2011 (in EUR) Descrizione Quantità/ Valore nominale Valore <strong>di</strong> mercato % <strong>del</strong> patrimonio netto I. VALORI MOBILIARI AMMESSI ALLA QUOTAZIONE UFFICIALE DI UNA BORSA VALORI O NEGOZIATI SU UN ALTRO MERCATO REGOLAMENTATO Azioni in AUD Imdex Ltd 1,500,000 2,232,309 1.21 New Hope Corp Ltd 800,000 3,452,638 1.88 Whl Energy Ltd 25,000,000 881,175 0.48 6,566,122 3.57 Azioni in BRL Refinaria De Petroleos Manguinhos 4,000,000 2,239,846 1.22 2,239,846 1.22 Azioni in CAD Baytex Energy Corp 60,000 2,578,045 1.40 Birchcliff Energy Ltd 150,000 1,557,285 0.85 Canyon Services Group Inc 180,000 1,612,301 0.88 Coastal Energy Co 500,000 5,653,211 3.07 Ensign Energy Services Inc 200,000 2,459,828 1.34 Paramount Resources Ltd 75,000 2,422,317 1.32 Peyto Exploration & Dev Corp 120,000 2,215,209 1.21 Poseidon Concepts Corp 150,000 1,420,880 0.77 Provident Energy Ltd 350,000 2,639,667 1.44 Surge Energy Inc 350,000 2,376,470 1.29 Total Energy Services Inc 170,000 2,241,581 1.22 Trican Well Service Ltd 120,000 1,586,839 0.86 Trilogy Energy Corp 200,000 5,706,257 3.10 Whitecap Resources Inc 450,000 2,830,394 1.54 Wild Stream Exploration Inc 175,000 1,193,540 0.65 38,493,824 20.94 Azioni in EUR Dragon Oil Plc 700,000 3,795,759 2.07 Sbm Offshore NV 65,000 1,039,350 0.57 Technip-Coflexip SA 50,000 3,626,000 1.97 8,461,109 4.61 Azioni in GBP Gulf Keystone Petroleum Ltd 600,000 1,347,882 0.73 John Wood Group Plc 225,000 1,712,114 0.93 Kentz Corp 500,000 2,508,657 1.37 Petrofac Ltd 180,000 3,101,916 1.69 Premier Oil Plc 400,000 1,721,857 0.94 Rockhopper Exploration Plc 350,000 1,090,759 0.59 11,483,185 6.25 La nota integrativa costituisce parte integrante <strong>del</strong> presente bilancio. Descrizione Quantità/ Valore nominale Valore <strong>di</strong> mercato % <strong>del</strong> patrimonio netto Azioni in IDR United Tractors Tbk PT 2,000,166 4,404,341 2.40 4,404,341 2.40 Azioni in INR Petronet LNG Ltd 700,000 1,638,695 0.89 1,638,695 0.89 Azioni in JPY JGC Corp 70,000 1,273,386 0.69 1,273,386 0.69 Azioni in MYR Petronas Dagangan Bhd 450,000 1,897,122 1.03 Sapuracrest Petrol Ord 2,500,000 2,753,690 1.50 4,650,812 2.53 Azioni in NOK Acergy SA 90,000 1,290,731 0.70 Det Norske Oljeselskap ASA TGS Nopec Geophysical 250,000 2,797,549 1.52 Co ASA 70,000 1,211,885 0.66 5,300,165 2.88 Azioni in PHP Semirara Mining Corp 750,000 2,931,851 1.60 2,931,851 1.60 Azioni in SEK Lun<strong>di</strong>n Petroleum AB 150,000 2,812,303 1.53 2,812,303 1.53 Azioni in SGD Straits Asia Resources Ltd 900,000 985,686 0.54 985,686 0.54 Azioni in USD Basic Energy Services Inc 100,000 1,540,128 0.84 Cabot Oil & Gas Corp 60,000 3,575,049 1.95 Cameron Intl Corp 60,000 2,260,249 1.23 Carbo Ceramics Inc 15,000 1,465,329 0.80 Cimarex Energy Co 40,000 1,928,993 1.05 Clayton Williams Energy Inc 45,000 2,689,301 1.46 Cloud Peak Energy Inc 120,000 1,790,545 0.97 125