Prospetto di composizione del portafoglio titoli e altre
Prospetto di composizione del portafoglio titoli e altre
Prospetto di composizione del portafoglio titoli e altre

Create successful ePaper yourself
Turn your PDF publications into a flip-book with our unique Google optimized e-Paper software.
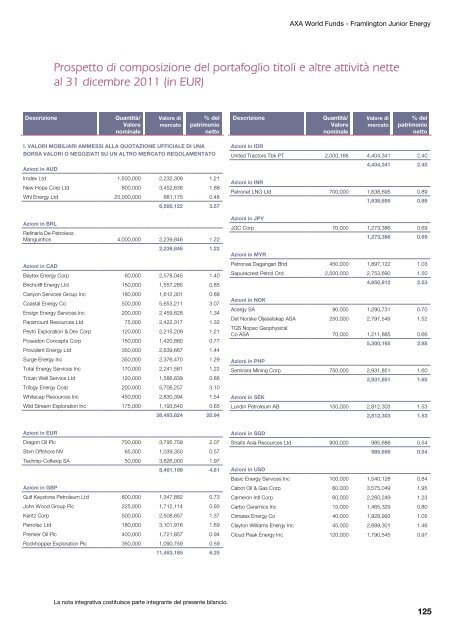
AXA World Funds - Framlington Junior Energy<br />
<strong>Prospetto</strong> <strong>di</strong> <strong>composizione</strong> <strong>del</strong> <strong>portafoglio</strong> <strong>titoli</strong> e <strong>altre</strong> attività nette<br />
al 31 <strong>di</strong>cembre 2011 (in EUR)<br />
Descrizione Quantità/<br />
Valore<br />
nominale<br />
Valore <strong>di</strong><br />
mercato<br />
% <strong>del</strong><br />
patrimonio<br />
netto<br />
I. VALORI MOBILIARI AMMESSI ALLA QUOTAZIONE UFFICIALE DI UNA<br />
BORSA VALORI O NEGOZIATI SU UN ALTRO MERCATO REGOLAMENTATO<br />
Azioni in AUD<br />
Imdex Ltd 1,500,000 2,232,309 1.21<br />
New Hope Corp Ltd 800,000 3,452,638 1.88<br />
Whl Energy Ltd 25,000,000 881,175 0.48<br />
6,566,122 3.57<br />
Azioni in BRL<br />
Refinaria De Petroleos<br />
Manguinhos 4,000,000 2,239,846 1.22<br />
2,239,846 1.22<br />
Azioni in CAD<br />
Baytex Energy Corp 60,000 2,578,045 1.40<br />
Birchcliff Energy Ltd 150,000 1,557,285 0.85<br />
Canyon Services Group Inc 180,000 1,612,301 0.88<br />
Coastal Energy Co 500,000 5,653,211 3.07<br />
Ensign Energy Services Inc 200,000 2,459,828 1.34<br />
Paramount Resources Ltd 75,000 2,422,317 1.32<br />
Peyto Exploration & Dev Corp 120,000 2,215,209 1.21<br />
Poseidon Concepts Corp 150,000 1,420,880 0.77<br />
Provident Energy Ltd 350,000 2,639,667 1.44<br />
Surge Energy Inc 350,000 2,376,470 1.29<br />
Total Energy Services Inc 170,000 2,241,581 1.22<br />
Trican Well Service Ltd 120,000 1,586,839 0.86<br />
Trilogy Energy Corp 200,000 5,706,257 3.10<br />
Whitecap Resources Inc 450,000 2,830,394 1.54<br />
Wild Stream Exploration Inc 175,000 1,193,540 0.65<br />
38,493,824 20.94<br />
Azioni in EUR<br />
Dragon Oil Plc 700,000 3,795,759 2.07<br />
Sbm Offshore NV 65,000 1,039,350 0.57<br />
Technip-Coflexip SA 50,000 3,626,000 1.97<br />
8,461,109 4.61<br />
Azioni in GBP<br />
Gulf Keystone Petroleum Ltd 600,000 1,347,882 0.73<br />
John Wood Group Plc 225,000 1,712,114 0.93<br />
Kentz Corp 500,000 2,508,657 1.37<br />
Petrofac Ltd 180,000 3,101,916 1.69<br />
Premier Oil Plc 400,000 1,721,857 0.94<br />
Rockhopper Exploration Plc 350,000 1,090,759 0.59<br />
11,483,185 6.25<br />
La nota integrativa costituisce parte integrante <strong>del</strong> presente bilancio.<br />
Descrizione Quantità/<br />
Valore<br />
nominale<br />
Valore <strong>di</strong><br />
mercato<br />
% <strong>del</strong><br />
patrimonio<br />
netto<br />
Azioni in IDR<br />
United Tractors Tbk PT 2,000,166 4,404,341 2.40<br />
4,404,341 2.40<br />
Azioni in INR<br />
Petronet LNG Ltd 700,000 1,638,695 0.89<br />
1,638,695 0.89<br />
Azioni in JPY<br />
JGC Corp 70,000 1,273,386 0.69<br />
1,273,386 0.69<br />
Azioni in MYR<br />
Petronas Dagangan Bhd 450,000 1,897,122 1.03<br />
Sapuracrest Petrol Ord 2,500,000 2,753,690 1.50<br />
4,650,812 2.53<br />
Azioni in NOK<br />
Acergy SA 90,000 1,290,731 0.70<br />
Det Norske Oljeselskap ASA<br />
TGS Nopec Geophysical<br />
250,000 2,797,549 1.52<br />
Co ASA 70,000 1,211,885 0.66<br />
5,300,165 2.88<br />
Azioni in PHP<br />
Semirara Mining Corp 750,000 2,931,851 1.60<br />
2,931,851 1.60<br />
Azioni in SEK<br />
Lun<strong>di</strong>n Petroleum AB 150,000 2,812,303 1.53<br />
2,812,303 1.53<br />
Azioni in SGD<br />
Straits Asia Resources Ltd 900,000 985,686 0.54<br />
985,686 0.54<br />
Azioni in USD<br />
Basic Energy Services Inc 100,000 1,540,128 0.84<br />
Cabot Oil & Gas Corp 60,000 3,575,049 1.95<br />
Cameron Intl Corp 60,000 2,260,249 1.23<br />
Carbo Ceramics Inc 15,000 1,465,329 0.80<br />
Cimarex Energy Co 40,000 1,928,993 1.05<br />
Clayton Williams Energy Inc 45,000 2,689,301 1.46<br />
Cloud Peak Energy Inc 120,000 1,790,545 0.97<br />
125