

sectoral economic costs and benefits of ghg mitigation - IPCC
sectoral economic costs and benefits of ghg mitigation - IPCC
sectoral economic costs and benefits of ghg mitigation - IPCC

Create successful ePaper yourself
Turn your PDF publications into a flip-book with our unique Google optimized e-Paper software.
Seth Dunn<br />
3 An Integrated Approach to Transport GHG Mitigation<br />
One <strong>of</strong> the central findings <strong>of</strong> a 1997 Worldwatch assessment <strong>of</strong> climate <strong>mitigation</strong> policies in<br />
industrial nations was that there is no “magic bullet:” only a combination <strong>of</strong> mutually-reinforcing<br />
measures will be effective in inducing sustained emissions reductions. This is particularly true in<br />
the transportation sector, where in several nations low fuel prices have encouraged greater<br />
vehicular travel, diminishing the impact <strong>of</strong> fuel economy st<strong>and</strong>ards. But the need for<br />
strengthening these st<strong>and</strong>ards, <strong>and</strong> for adding clean vehicle m<strong>and</strong>ates, remains, given the<br />
prominence <strong>of</strong> the automobile in the transport sector’s 21 percent share <strong>of</strong> carbon emissions.<br />
However, measures to restrict dem<strong>and</strong> for automobile use, including fuel price reform as well as<br />
l<strong>and</strong> use policies that facilitate the use <strong>of</strong> alternatives to the automobile, are also necessary. This<br />
section focuses on the importance <strong>of</strong> integrating fuel economy st<strong>and</strong>ards, clean car m<strong>and</strong>ates, <strong>and</strong><br />
l<strong>and</strong> use policies into a transport sector GHG <strong>mitigation</strong> strategy, drawing primarily on the U.S.<br />
experience.<br />
Boosting Fuel Economy St<strong>and</strong>ards<br />
St<strong>and</strong>ards established in the 1970s improved energy efficiency markedly during the 1980s, but<br />
governments have generally not strengthened them since - leading to a decline in fuel economy<br />
in the 1990s. In the absence <strong>of</strong> new st<strong>and</strong>ards, emissions from road transport are projected to<br />
double, with much <strong>of</strong> the increase occurring in developing countries. According to the <strong>IPCC</strong>’s<br />
1996 Technical Paper, higher fuel economy could cut this projected amount by as much as a<br />
quarter.<br />
The only binding auto efficiency st<strong>and</strong>ards in place among industrial countries today are in the<br />
United States, where they have remained flat since 1985 (See Table 3).<br />
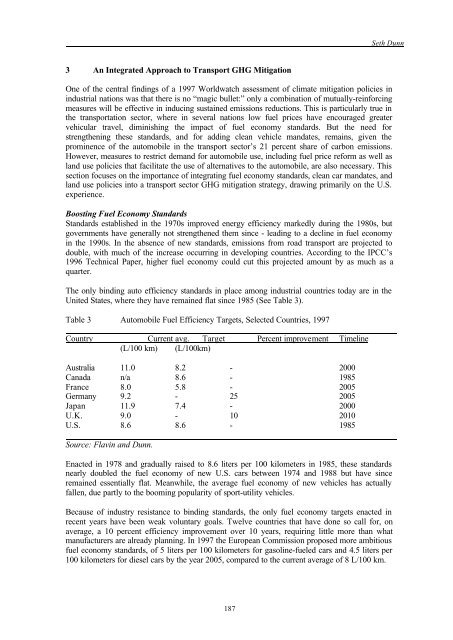
Table 3 Automobile Fuel Efficiency Targets, Selected Countries, 1997<br />
Country Current avg. Target Percent improvement Timeline<br />
(L/100 km) (L/100km)<br />
Australia 11.0 8.2 - 2000<br />
Canada n/a 8.6 - 1985<br />
France 8.0 5.8 - 2005<br />
Germany 9.2 - 25 2005<br />
Japan 11.9 7.4 - 2000<br />
U.K. 9.0 - 10 2010<br />
U.S. 8.6 8.6 - 1985<br />
Source: Flavin <strong>and</strong> Dunn.<br />
Enacted in 1978 <strong>and</strong> gradually raised to 8.6 liters per 100 kilometers in 1985, these st<strong>and</strong>ards<br />
nearly doubled the fuel economy <strong>of</strong> new U.S. cars between 1974 <strong>and</strong> 1988 but have since<br />
remained essentially flat. Meanwhile, the average fuel economy <strong>of</strong> new vehicles has actually<br />
fallen, due partly to the booming popularity <strong>of</strong> sport-utility vehicles.<br />
Because <strong>of</strong> industry resistance to binding st<strong>and</strong>ards, the only fuel economy targets enacted in<br />
recent years have been weak voluntary goals. Twelve countries that have done so call for, on<br />
average, a 10 percent efficiency improvement over 10 years, requiring little more than what<br />
manufacturers are already planning. In 1997 the European Commission proposed more ambitious<br />
fuel economy st<strong>and</strong>ards, <strong>of</strong> 5 liters per 100 kilometers for gasoline-fueled cars <strong>and</strong> 4.5 liters per<br />
100 kilometers for diesel cars by the year 2005, compared to the current average <strong>of</strong> 8 L/100 km.<br />
187


