

sectoral economic costs and benefits of ghg mitigation - IPCC
sectoral economic costs and benefits of ghg mitigation - IPCC
sectoral economic costs and benefits of ghg mitigation - IPCC

Create successful ePaper yourself
Turn your PDF publications into a flip-book with our unique Google optimized e-Paper software.
Somnath Bhattacharjee<br />
technological obsolescence, information deficiency <strong>and</strong> poor management practices to nonavailability<br />
<strong>of</strong> credits. There are some highly energy intensive sub sectors where the cost <strong>of</strong><br />
energy forms a sizeable proportion <strong>of</strong> the total production cost <strong>and</strong> <strong>of</strong>fers tremendous scope for<br />
energy efficiency improvement <strong>and</strong> pollution reduction through technology up gradation.<br />
As is clear from the preceding discussion, the energy intensive industries in India <strong>of</strong>fer huge<br />
potential for energy saving with a corresponding reduction in global as well as local emissions.<br />
The <strong>costs</strong> associated to affect this change <strong>and</strong> the associated <strong>benefits</strong> are, however, sector<br />
specific. In this paper, for illustrative purposes, three case studies are presented, primarily based<br />
on the research findings at TERI. These case studies pertain to two energy intensive sectors<br />
under large-scale industry namely pulp <strong>and</strong> paper <strong>and</strong> cement, <strong>and</strong> one energy intensive smallscale<br />
industry sector - the case iron foundry industry.<br />
Case Study I Pulp <strong>and</strong> paper industry<br />
The pulp <strong>and</strong> paper industry is one <strong>of</strong> the key industrial sectors in India, <strong>and</strong> is the country’s sixth<br />
largest consumer <strong>of</strong> energy. The energy cost presently accounts for about 25% <strong>of</strong> the total cost <strong>of</strong><br />
manufacturing, <strong>and</strong> is steadily rising every year. The average size <strong>of</strong> paper mills in India is only<br />
45tpd, as against 900tpd in Europe <strong>and</strong> North America. As against a total installed capacity <strong>of</strong> 4.3<br />
million tonnes (in 96/97), the production was only 3.26 million tonnes, on account <strong>of</strong> low<br />
capacity utilisation.<br />
Energy performance<br />
The main fuel used by the industry is coal, which accounts for about 70% <strong>of</strong> the total energy use.<br />
The primary energy consumption in the sector rose from 45.9 PJ in 1981–82 to 74.5 PJ in 1993–<br />
94.<br />
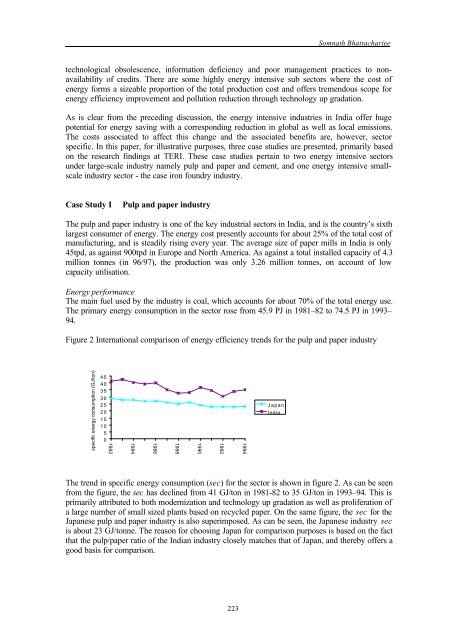
Figure 2 International comparison <strong>of</strong> energy efficiency trends for the pulp <strong>and</strong> paper industry<br />
specific energy consumption (GJ/ton)<br />
45<br />
40<br />
35<br />
30<br />
25<br />
20<br />
15<br />
10<br />
5<br />
0<br />
1982<br />
1984<br />
1986<br />
1988<br />
1990<br />
1992<br />
1994<br />
Japan<br />
India<br />
The trend in specific energy consumption (sec) for the sector is shown in figure 2. As can be seen<br />
from the figure, the sec has declined from 41 GJ/ton in 1981-82 to 35 GJ/ton in 1993–94. This is<br />
primarily attributed to both modernization <strong>and</strong> technology up gradation as well as proliferation <strong>of</strong><br />
a large number <strong>of</strong> small sized plants based on recycled paper. On the same figure, the sec for the<br />
Japanese pulp <strong>and</strong> paper industry is also superimposed. As can be seen, the Japanese industry sec<br />
is about 23 GJ/tonne. The reason for choosing Japan for comparison purposes is based on the fact<br />
that the pulp/paper ratio <strong>of</strong> the Indian industry closely matches that <strong>of</strong> Japan, <strong>and</strong> thereby <strong>of</strong>fers a<br />
good basis for comparison.<br />
223


