sectoral economic costs and benefits of ghg mitigation - IPCC
sectoral economic costs and benefits of ghg mitigation - IPCC
sectoral economic costs and benefits of ghg mitigation - IPCC
Create successful ePaper yourself
Turn your PDF publications into a flip-book with our unique Google optimized e-Paper software.
Gina Roos<br />
emissions 6.5% to this. Under the <strong>IPCC</strong> methodology, the total energy sector contributed 89% <strong>of</strong><br />
the total CO 2 equivalent emissions. Further breakdowns <strong>of</strong> contributions in the energy sector are<br />
given in Table 1 below.<br />
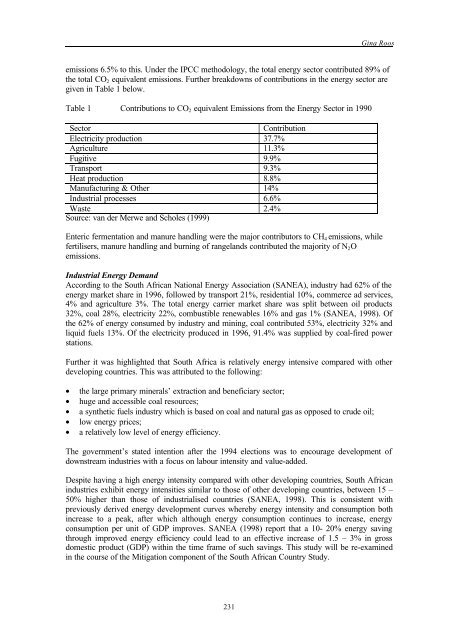
Table 1 Contributions to CO 2 equivalent Emissions from the Energy Sector in 1990<br />
Sector<br />
Contribution<br />
Electricity production 37.7%<br />
Agriculture 11.3%<br />
Fugitive 9.9%<br />
Transport 9.3%<br />
Heat production 8.8%<br />
Manufacturing & Other 14%<br />
Industrial processes 6.6%<br />
Waste 2.4%<br />
Source: van der Merwe <strong>and</strong> Scholes (1999)<br />
Enteric fermentation <strong>and</strong> manure h<strong>and</strong>ling were the major contributors to CH 4 emissions, while<br />
fertilisers, manure h<strong>and</strong>ling <strong>and</strong> burning <strong>of</strong> rangel<strong>and</strong>s contributed the majority <strong>of</strong> N 2 O<br />
emissions.<br />
Industrial Energy Dem<strong>and</strong><br />
According to the South African National Energy Association (SANEA), industry had 62% <strong>of</strong> the<br />
energy market share in 1996, followed by transport 21%, residential 10%, commerce ad services,<br />
4% <strong>and</strong> agriculture 3%. The total energy carrier market share was split between oil products<br />
32%, coal 28%, electricity 22%, combustible renewables 16% <strong>and</strong> gas 1% (SANEA, 1998). Of<br />
the 62% <strong>of</strong> energy consumed by industry <strong>and</strong> mining, coal contributed 53%, electricity 32% <strong>and</strong><br />
liquid fuels 13%. Of the electricity produced in 1996, 91.4% was supplied by coal-fired power<br />
stations.<br />
Further it was highlighted that South Africa is relatively energy intensive compared with other<br />
developing countries. This was attributed to the following:<br />
• the large primary minerals’ extraction <strong>and</strong> beneficiary sector;<br />
• huge <strong>and</strong> accessible coal resources;<br />
• a synthetic fuels industry which is based on coal <strong>and</strong> natural gas as opposed to crude oil;<br />
• low energy prices;<br />
• a relatively low level <strong>of</strong> energy efficiency.<br />
The government’s stated intention after the 1994 elections was to encourage development <strong>of</strong><br />
downstream industries with a focus on labour intensity <strong>and</strong> value-added.<br />
Despite having a high energy intensity compared with other developing countries, South African<br />
industries exhibit energy intensities similar to those <strong>of</strong> other developing countries, between 15 –<br />
50% higher than those <strong>of</strong> industrialised countries (SANEA, 1998). This is consistent with<br />
previously derived energy development curves whereby energy intensity <strong>and</strong> consumption both<br />
increase to a peak, after which although energy consumption continues to increase, energy<br />
consumption per unit <strong>of</strong> GDP improves. SANEA (1998) report that a 10- 20% energy saving<br />
through improved energy efficiency could lead to an effective increase <strong>of</strong> 1.5 – 3% in gross<br />
domestic product (GDP) within the time frame <strong>of</strong> such savings. This study will be re-examined<br />
in the course <strong>of</strong> the Mitigation component <strong>of</strong> the South African Country Study.<br />
231


