- Page 1 and 2: INTERGOVERNMENTAL PANEL ON CLIMATE
- Page 3 and 4: Preface Preface Assessment of the s
- Page 5 and 6: Contents Additional Submissions ♣
- Page 7 and 8: PART I INTRODUCTION AND SUMMARY 1
- Page 9 and 10: Ogunlade Davidson I therefore urge
- Page 11 and 12: Lenny Bernstein from mitigation mea
- Page 13 and 14: Terry Barker, Lenny Bernstein, Ken
- Page 15 and 16: Terry Barker, Lenny Bernstein, Ken
- Page 17 and 18: Terry Barker, Lenny Bernstein, Ken
- Page 19 and 20: Terry Barker, Lenny Bernstein, Ken
- Page 21 and 22: Terry Barker, Lenny Bernstein, Ken
- Page 23 and 24: Terry Barker, Lenny Bernstein, Ken
- Page 25 and 26: Terry Barker, Lenny Bernstein, Ken
- Page 27 and 28: Terry Barker, Lenny Bernstein, Ken
- Page 29 and 30: Terry Barker, Lenny Bernstein, Ken
- Page 31 and 32: Terry Barker, Lenny Bernstein, Ken
- Page 33 and 34: Terry Barker, Lenny Bernstein, Ken
- Page 35 and 36: Terry Barker, Lenny Bernstein, Ken
- Page 37 and 38: Terry Barker, Lenny Bernstein, Ken
- Page 39 and 40: Terry Barker, Lenny Bernstein, Ken
- Page 41 and 42: Terry Barker, Lenny Bernstein, Ken
- Page 43 and 44: Ulrich Bartsch and Benito Müller I
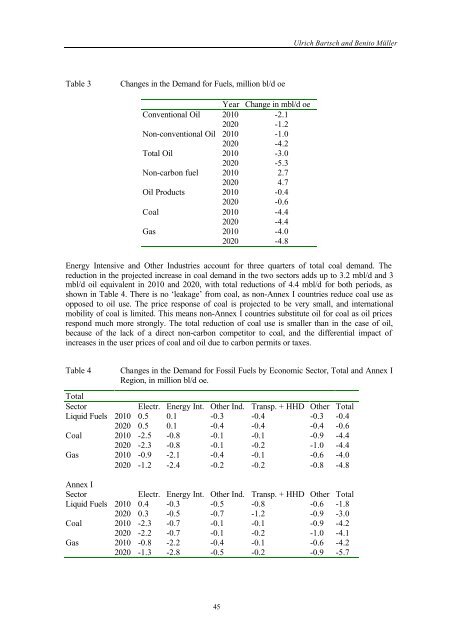
- Page 45 and 46: Ulrich Bartsch and Benito Müller c
- Page 47 and 48: Ulrich Bartsch and Benito Müller m
- Page 49: Ulrich Bartsch and Benito Müller 5
- Page 53 and 54: Ulrich Bartsch and Benito Müller F
- Page 55 and 56: Ulrich Bartsch and Benito Müller T
- Page 57 and 58: Ulrich Bartsch and Benito Müller R
- Page 59 and 60: Ulrich Bartsch and Benito Müller C
- Page 61 and 62: Ron Knapp The top seven coal export
- Page 63 and 64: Ron Knapp would impose on the US ec
- Page 65 and 66: Ron Knapp "Because of the high carb
- Page 67 and 68: Ron Knapp the adverse impact of Kyo
- Page 69 and 70: Davoud Ghasemzadeh and Faten Alawad
- Page 71 and 72: Davoud Ghasemzadeh and Faten Alawad
- Page 73 and 74: Davoud Ghasemzadeh and Faten Alawad
- Page 75 and 76: Jonathan Stern Discussion: Impact o
- Page 77 and 78: Jonathan Stern Energy Research Inst
- Page 79 and 80: Jonathan Stern “Hot Air” Finall
- Page 81 and 82: Seth Dunn and Michael Renner Table
- Page 83 and 84: Seth Dunn and Michael Renner Servic
- Page 85 and 86: Seth Dunn and Michael Renner Figure
- Page 87 and 88: Seth Dunn and Michael Renner Table
- Page 89 and 90: Seth Dunn and Michael Renner Policy
- Page 91 and 92: Jonathan Pershing Fossil Fuel Impli
- Page 93 and 94: Jonathan Pershing Economic Models A
- Page 95 and 96: Jonathan Pershing uneven, and that
- Page 97 and 98: Jonathan Pershing global oversupply
- Page 99 and 100: Jonathan Pershing Table 5 Oil Produ
- Page 101 and 102:
Jonathan Pershing The question of t
- Page 103 and 104:
Jonathan Pershing Gas demand will v
- Page 105 and 106:
Jonathan Pershing It is necessary t
- Page 107 and 108:
Jonathan Pershing According to the
- Page 109 and 110:
Jonathan Pershing (h) Countries who
- Page 111 and 112:
PART III RENEWABLE ENERGY 105
- Page 113 and 114:
Patrick Criqui, Nikos Kouvaritakis
- Page 115 and 116:
Patrick Criqui, Nikos Kouvaritakis
- Page 117 and 118:
Patrick Criqui, Nikos Kouvaritakis
- Page 119 and 120:
Patrick Criqui, Nikos Kouvaritakis
- Page 121 and 122:
Patrick Criqui, Nikos Kouvaritakis
- Page 123 and 124:
Patrick Criqui, Nikos Kouvaritakis
- Page 125 and 126:
Patrick Criqui, Nikos Kouvaritakis
- Page 127 and 128:
Patrick Criqui, Nikos Kouvaritakis
- Page 129 and 130:
Patrick Criqui, Nikos Kouvaritakis
- Page 131 and 132:
Patrick Criqui, Nikos Kouvaritakis
- Page 133 and 134:
Patrick Criqui, Nikos Kouvaritakis
- Page 135 and 136:
Patrick Criqui, Nikos Kouvaritakis
- Page 137 and 138:
Patrick Criqui, Nikos Kouvaritakis
- Page 139 and 140:
Patrick Criqui, Nikos Kouvaritakis
- Page 141 and 142:
Patrick Criqui, Nikos Kouvaritakis
- Page 143 and 144:
José R. Moreira Discussion: Biomas
- Page 145 and 146:
José R. Moreira 5 Case C - Social
- Page 147 and 148:
José R Moreira The results indicat
- Page 149 and 150:
José R Moreira 7 Case E - Health D
- Page 151 and 152:
José R Moreira When a project is u
- Page 153 and 154:
Garba G. Dieudonne Impacts of Mitig
- Page 155 and 156:
Garba G. Dieudonne SMALL-SCALL HYDR
- Page 157 and 158:
Garba G. Dieudonne Issues Associate
- Page 159 and 160:
Garba G. Dieudonne The us of renewa
- Page 161 and 162:
Garba G. Dieudonne cooperatives and
- Page 163:
Oliver Headley Table 1 Intense Hurr
- Page 166 and 167:
Renewable Energy Table 3 Examples o
- Page 168 and 169:
Renewable Energy Table 5 Comparison
- Page 170 and 171:
Transport Mitigating GHG Emissions
- Page 172 and 173:
Transport the two objectives is the
- Page 174 and 175:
Transport The rapid expansion in th
- Page 176 and 177:
Transport Altering the mix of vehic
- Page 178 and 179:
Transport in the 1990s. Railways, d
- Page 180 and 181:
Transport The Indian study conclude
- Page 182 and 183:
Transport Synergy between local and
- Page 184 and 185:
Transport Figure 6 Transport relate
- Page 186 and 187:
Transport Lack of technology data D
- Page 188 and 189:
Transport • 10% of the autoricksh
- Page 190 and 191:
Transport Categories vary in applic
- Page 192 and 193:
Transport innovative mechanisms suc
- Page 194 and 195:
Transport Clean Car Mandates: Tappi
- Page 196 and 197:
Transport Table 5 Tellus Institute
- Page 198 and 199:
Transport used cars with up to twen
- Page 200 and 201:
Transport for air pollution and noi
- Page 202 and 203:
Transport The first category has lo
- Page 204 and 205:
Transport Figure 4 New Light-Duty V
- Page 206 and 207:
Transport Figure 6 Regional Effects
- Page 208 and 209:
Transport There are significant dif
- Page 210 and 211:
Transport Figure 8 Net Energy Balan
- Page 212 and 213:
Transport As a last remark it is us
- Page 214 and 215:
PART V ENERGY INTENSIVE INDUSTRIES
- Page 216 and 217:
Energy Intensive Industries framewo
- Page 218 and 219:
Energy Intensive Industries intensi
- Page 220 and 221:
Energy Intensive Industries a reduc
- Page 222 and 223:
Energy Intensive Industries column,
- Page 224 and 225:
Energy Intensive Industries goods f
- Page 226 and 227:
Energy Intensive Industries The fin
- Page 228 and 229:
Energy Intensive Industries Costs a
- Page 230 and 231:
Energy Intensive Industries Environ
- Page 232 and 233:
Energy Intensive Industries Figure
- Page 234 and 235:
Energy Intensive Industries 13% to
- Page 236 and 237:
Energy Intensive Industries Costs a
- Page 238 and 239:
Energy Intensive Industries SANEA (
- Page 240 and 241:
Energy Intensive Industries In the
- Page 242 and 243:
Energy Intensive Industries SANEA 1
- Page 244 and 245:
Energy Intensive Industries energy
- Page 246 and 247:
Energy Intensive Industries Impacts
- Page 248 and 249:
Energy Intensive Industries Over th
- Page 250 and 251:
Energy Intensive Industries natural
- Page 252 and 253:
Energy Intensive Industries • The
- Page 254 and 255:
Energy Intensive Industries element
- Page 256 and 257:
Energy Intensive Industries (D) Alt
- Page 258 and 259:
Energy Intensive Industries the ass
- Page 260 and 261:
Households and Services Ancilliary
- Page 262 and 263:
Households and Services it is based
- Page 264 and 265:
Households and Services • Heating
- Page 266 and 267:
Households and Services Impact of G
- Page 268 and 269:
Households and Services This defini
- Page 270 and 271:
Households and Services operating c
- Page 272 and 273:
Households and Services 3.2 Technic
- Page 274 and 275:
Households and Services Tennant, T.
- Page 276 and 277:
PART VII PANEL DISCUSSION 270
- Page 278 and 279:
Panel Discussion In some sectors (p
- Page 280 and 281:
Appendix Appendix A Meeting Program
- Page 282 and 283:
Appendix 1030 Coffee/Tea 1100 Sessi
- Page 284 and 285:
Appendix Marc Darras Gaz de France,