

sectoral economic costs and benefits of ghg mitigation - IPCC
sectoral economic costs and benefits of ghg mitigation - IPCC
sectoral economic costs and benefits of ghg mitigation - IPCC

You also want an ePaper? Increase the reach of your titles
YUMPU automatically turns print PDFs into web optimized ePapers that Google loves.
Fossil Fuels<br />
exporting countries, it would increase current oil revenues (based on 1998 average oil prices) by<br />
53% in case <strong>of</strong> equal distribution <strong>and</strong> by 75 % if the added dem<strong>and</strong> is split between the Top 10<br />
producing countries. Of course, as noted above, this provides an extremely conservative scenario:<br />
the increase in production is more likely to be divided as a function <strong>of</strong> the marginal cost <strong>of</strong><br />
production <strong>and</strong> transport <strong>of</strong> the marginal barrel <strong>of</strong> oil, disproportionately weighting the<br />
production increases toward OPEC countries.<br />
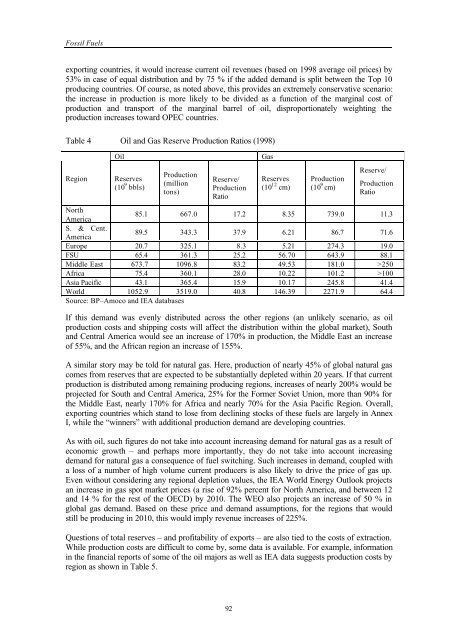
Table 4 Oil <strong>and</strong> Gas Reserve Production Ratios (1998)<br />
Region<br />
Oil<br />
Reserves<br />
(10 9 bbls)<br />
Production<br />
(million<br />
tons)<br />
Reserve/<br />
Production<br />
Ratio<br />
Gas<br />
Reserves<br />
(10 12 cm)<br />
Production<br />
(10 9 cm)<br />
Reserve/<br />
Production<br />
Ratio<br />
North<br />
America<br />
85.1 667.0 17.2 8.35 739.0 11.3<br />
S. & Cent.<br />
America<br />
89.5 343.3 37.9 6.21 86.7 71.6<br />
Europe 20.7 325.1 8.3 5.21 274.3 19.0<br />
FSU 65.4 361.3 25.2 56.70 643.9 88.1<br />
Middle East 673.7 1096.8 83.2 49.53 181.0 >250<br />
Africa 75.4 360.1 28.0 10.22 101.2 >100<br />
Asia Pacific 43.1 365.4 15.9 10.17 245.8 41.4<br />
World 1052.9 3519.0 40.8 146.39 2271.9 64.4<br />
Source: BP–Amoco <strong>and</strong> IEA databases<br />
If this dem<strong>and</strong> was evenly distributed across the other regions (an unlikely scenario, as oil<br />
production <strong>costs</strong> <strong>and</strong> shipping <strong>costs</strong> will affect the distribution within the global market), South<br />
<strong>and</strong> Central America would see an increase <strong>of</strong> 170% in production, the Middle East an increase<br />
<strong>of</strong> 55%, <strong>and</strong> the African region an increase <strong>of</strong> 155%.<br />
A similar story may be told for natural gas. Here, production <strong>of</strong> nearly 45% <strong>of</strong> global natural gas<br />
comes from reserves that are expected to be substantially depleted within 20 years. If that current<br />
production is distributed among remaining producing regions, increases <strong>of</strong> nearly 200% would be<br />
projected for South <strong>and</strong> Central America, 25% for the Former Soviet Union, more than 90% for<br />
the Middle East, nearly 170% for Africa <strong>and</strong> nearly 70% for the Asia Pacific Region. Overall,<br />
exporting countries which st<strong>and</strong> to lose from declining stocks <strong>of</strong> these fuels are largely in Annex<br />
I, while the “winners” with additional production dem<strong>and</strong> are developing countries.<br />
As with oil, such figures do not take into account increasing dem<strong>and</strong> for natural gas as a result <strong>of</strong><br />
<strong>economic</strong> growth – <strong>and</strong> perhaps more importantly, they do not take into account increasing<br />
dem<strong>and</strong> for natural gas a consequence <strong>of</strong> fuel switching. Such increases in dem<strong>and</strong>, coupled with<br />
a loss <strong>of</strong> a number <strong>of</strong> high volume current producers is also likely to drive the price <strong>of</strong> gas up.<br />
Even without considering any regional depletion values, the IEA World Energy Outlook projects<br />
an increase in gas spot market prices (a rise <strong>of</strong> 92% percent for North America, <strong>and</strong> between 12<br />
<strong>and</strong> 14 % for the rest <strong>of</strong> the OECD) by 2010. The WEO also projects an increase <strong>of</strong> 50 % in<br />
global gas dem<strong>and</strong>. Based on these price <strong>and</strong> dem<strong>and</strong> assumptions, for the regions that would<br />
still be producing in 2010, this would imply revenue increases <strong>of</strong> 225%.<br />
Questions <strong>of</strong> total reserves – <strong>and</strong> pr<strong>of</strong>itability <strong>of</strong> exports – are also tied to the <strong>costs</strong> <strong>of</strong> extraction.<br />
While production <strong>costs</strong> are difficult to come by, some data is available. For example, information<br />
in the financial reports <strong>of</strong> some <strong>of</strong> the oil majors as well as IEA data suggests production <strong>costs</strong> by<br />
region as shown in Table 5.<br />
92


