

sectoral economic costs and benefits of ghg mitigation - IPCC
sectoral economic costs and benefits of ghg mitigation - IPCC
sectoral economic costs and benefits of ghg mitigation - IPCC

You also want an ePaper? Increase the reach of your titles
YUMPU automatically turns print PDFs into web optimized ePapers that Google loves.
Fossil Fuels<br />
A second issue that must also be considered in this discussion is whether, even absent climate<br />
<strong>mitigation</strong> policies, current energy <strong>and</strong> energy related activities would be unchanged. This is a<br />
question that is seldom raised in the context <strong>of</strong> examining impacts on fossil fuel exporters –<br />
although, in theory, the “business-as-usual” case defines the trend that analysts think may obtain<br />
without climate policies. Here too, some assessment <strong>of</strong> possible energy trends suggests that<br />
rethinking may be required to accurately assess the “reference” case against which any impacts<br />
might need to be measured. For example, in coal-based power generation, efforts to reduce<br />
emissions <strong>of</strong> sulfur, particulates <strong>and</strong> oxides <strong>of</strong> nitrogen are already having a significant effect on<br />
coal use <strong>and</strong> operating <strong>costs</strong>; will future power be produced without coal, or will technology<br />
evolve to eliminate emissions <strong>of</strong> these criteria pollutants?<br />
In both the discussion <strong>of</strong> policy choices <strong>and</strong> the “no-climate-policy” case, there will clearly be<br />
different implications for each <strong>of</strong> the fossil fuels. For example, coal use in the future can be<br />
expected to follow a different path than oil or gas whether climate <strong>mitigation</strong> measures are taken<br />
or not. To help draw out these fuel-specific issues, the discussion <strong>of</strong> these questions in Section 2<br />
below has thus been divided, <strong>and</strong> looks separately at coal, <strong>and</strong> at oil & gas.<br />
Finally, a number <strong>of</strong> countries have already begun to face the prospects <strong>of</strong> reduced revenues from<br />
export <strong>of</strong> fossil fuels – <strong>and</strong> have begun to take actions to <strong>of</strong>fset some <strong>of</strong> the possible impacts <strong>of</strong><br />
these declining revenues. Considering their situations may provide a useful model that could<br />
apply more broadly should global climate <strong>mitigation</strong> efforts indeed prove detrimental to fossil<br />
fuel exporting countries. In addition, some <strong>of</strong> the <strong>mitigation</strong> policies that countries might adopt<br />
could be less “damaging” than others. These issues are broadly addressed in Part 3 <strong>of</strong> this paper.<br />
2 Fossil Fuels: Supply, Dem<strong>and</strong> <strong>and</strong> Emission Mitigation Options<br />
Approximately 85% <strong>of</strong> the world’s emissions <strong>of</strong> greenhouse gases come from the energy sector,<br />
<strong>and</strong> within this sector, almost all the emissions are from the combustion <strong>of</strong> fossil fuels. The 3,387<br />
million metric tons <strong>of</strong> crude oil, 2,296,152 million cubic meters <strong>of</strong> gas, <strong>and</strong> 3,796 million tons <strong>of</strong><br />
coal burned in 1997 accounted for 43%, 19% <strong>and</strong> 38% percent respectively, <strong>of</strong> the contribution<br />
to global carbon dioxide emissions.<br />
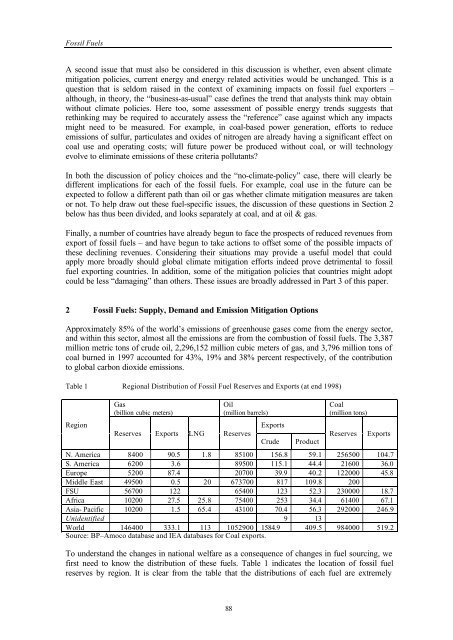
Table 1 Regional Distribution <strong>of</strong> Fossil Fuel Reserves <strong>and</strong> Exports (at end 1998)<br />
Region<br />
Gas<br />
(billion cubic meters)<br />
Oil<br />
(million barrels)<br />
Reserves Exports LNG Reserves<br />
Exports<br />
Crude<br />
Product<br />
Coal<br />
(million tons)<br />
Reserves<br />
Exports<br />
N. America 8400 90.5 1.8 85100 156.8 59.1 256500 104.7<br />
S. America 6200 3.6 89500 115.1 44.4 21600 36.0<br />
Europe 5200 87.4 20700 39.9 40.2 122000 45.8<br />
Middle East 49500 0.5 20 673700 817 109.8 200<br />
FSU 56700 122 65400 123 52.3 230000 18.7<br />
Africa 10200 27.5 25.8 75400 253 34.4 61400 67.1<br />
Asia- Pacific 10200 1.5 65.4 43100 70.4 56.3 292000 246.9<br />
Unidentified 9 13<br />
World 146400 333.1 113 1052900 1584.9 409.5 984000 519.2<br />
Source: BP–Amoco database <strong>and</strong> IEA databases for Coal exports.<br />
To underst<strong>and</strong> the changes in national welfare as a consequence <strong>of</strong> changes in fuel sourcing, we<br />
first need to know the distribution <strong>of</strong> these fuels. Table 1 indicates the location <strong>of</strong> fossil fuel<br />
reserves by region. It is clear from the table that the distributions <strong>of</strong> each fuel are extremely<br />
88


