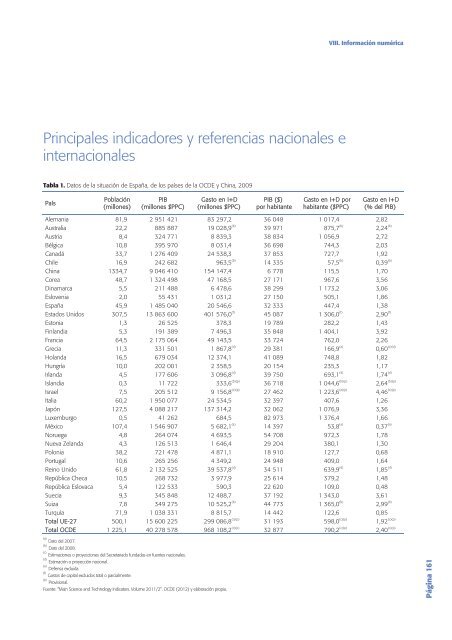
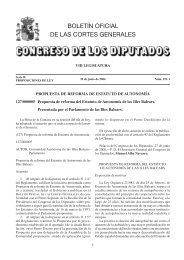
VIII. Información numéricaPrincipales indicadores y refer<strong>en</strong>cias nacionales einternacionalesTabla 1. Datos de la situación de <strong>España</strong>, de los países de la OCDE y China, 2009PaísPoblación(millones)PIB(millones $PPC)Gasto <strong>en</strong> I+D(millones $PPC)PIB ($)por habitanteGasto <strong>en</strong> I+D porhabitante ($PPC)Gasto <strong>en</strong> I+D(% del PIB)Alemania 81,9 2 951 421 83 297,2 36 048 1 017,4 2,82Australia 22,2 885 887 19 028,9 (b) 39 971 875,7 (b) 2,24 (b)Austria 8,4 324 771 8 839,3 38 834 1 056,9 2,72Bélgica 10,8 395 970 8 031,4 36 698 744,3 2,03Canadá 33,7 1 276 409 24 538,3 37 853 727,7 1,92Chile 16,9 242 682 963,5 (b) 14 335 57,5 (b) 0,39 (b)China 1334,7 9 046 410 154 147,4 6 778 115,5 1,70Corea 48,7 1 324 498 47 168,5 27 171 967,6 3,56Dinamarca 5,5 211 488 6 478,6 38 299 1 173,2 3,06Eslov<strong>en</strong>ia 2,0 55 431 1 031,2 27 150 505,1 1,86<strong>España</strong> 45,9 1 485 040 20 546,6 32 333 447,4 1,38Estados Unidos 307,5 13 863 600 401 576,0 (f) 45 087 1 306,0 (f) 2,90 (f)Estonia 1,3 26 525 378,3 19 789 282,2 1,43Finlandia 5,3 191 389 7 496,3 35 848 1 404,1 3,92Francia 64,5 2 175 064 49 143,5 33 724 762,0 2,26Grecia 11,3 331 501 1 867,8 (d) 29 381 166,9 (a) 0,60 (a)(d)Holanda 16,5 679 034 12 374,1 41 089 748,8 1,82Hungría 10,0 202 001 2 358,5 20 154 235,3 1,17Irlanda 4,5 177 606 3 096,8 (d) 39 750 693,1 (d) 1,74 (d)Islandia 0,3 11 722 333,6 (b)(p) 36 718 1 044,6 (b)(p) 2,64 (b)(p)Israel 7,5 205 512 9 156,8 (e)(p) 27 462 1 223,6 (e)(p) 4,46 (e)(p)Italia 60,2 1 950 077 24 534,5 32 397 407,6 1,26Japón 127,5 4 088 217 137 314,2 32 062 1 076,9 3,36Luxemburgo 0,5 41 262 684,5 82 973 1 376,4 1,66México 107,4 1 546 907 5 682,1 (a) 14 397 53,8 (a) 0,37 (a)Noruega 4,8 264 074 4 693,5 54 708 972,3 1,78Nueva Zelanda 4,3 126 513 1 646,4 29 204 380,1 1,30Polonia 38,2 721 478 4 871,1 18 910 127,7 0,68Portugal 10,6 265 256 4 349,2 24 948 409,0 1,64Reino Unido 61,8 2 132 525 39 537,8 (d) 34 511 639,9 (d) 1,85 (d)República Checa 10,5 268 732 3 977,9 25 614 379,2 1,48República Eslovaca 5,4 122 533 590,3 22 620 109,0 0,48Suecia 9,3 345 848 12 488,7 37 192 1 343,0 3,61Suiza 7,8 349 275 10 525,2 (b) 44 773 1 365,0 (b) 2,99 (b)Turquía 71,9 1 038 331 8 815,7 14 442 122,6 0,85Total UE-27 500,1 15 600 225 299 086,8 (c)(p) 31 193 598,0 (c)(p) 1,92 (c)(p)Total OCDE 1 225,1 40 278 578 968 108,2 (c)(p) 32 877 790,2 (c)(p) 2,40 (c)(p)(a) Dato del 2007.(b) Dato del 2008.(c) Estimaciones o proyecciones del Secretariado fundadas <strong>en</strong> fu<strong>en</strong>tes nacionales.(d) Estimación o proyección nacional.(e) Def<strong>en</strong>sa excluida.(f) Gastos de capital excluidos total o parcialm<strong>en</strong>te.(p) Provisional.Fu<strong>en</strong>te: “Main Sci<strong>en</strong>ce and Technology Indicators. Volume 2011/2”. OCDE (<strong>2012</strong>) y elaboración propia.Página 161
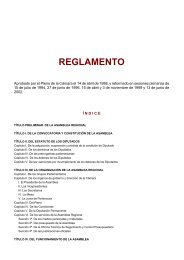
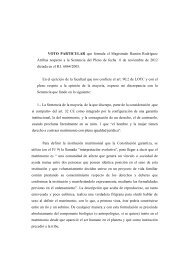
VIII. Información numéricaGasto <strong>en</strong> I+D - <strong>España</strong>Tabla 2. <strong>España</strong>. Gasto interno total <strong>en</strong> actividades de I+D, por sector de ejecución, <strong>en</strong> millones de euros corri<strong>en</strong>tes y constantes (2000- 2010)AñosTOTAL Administración Pública Enseñanza superior Empresas IPSFLCrte. Cte. 2005 Crte. Cte. 2005 % Crte. Cte. 2005 % Crte. Cte. 2005 % Crte. Cte. 2005 %1995 3 550 5 024 661 936 18,6 1 137 1 609 32,0 1 712 2 423 48,2 40 56 1,12000 5 719 7 022 905 1 111 15,8 1 694 2 080 29,6 3 069 3 768 53,7 51 63 0,92001 6 496 7 655 989 1 166 15,2 1 925 2 269 29,6 3 529 4 159 54,3 52 61 0,82002 7 194 8 127 1 108 1 252 15,4 2 142 2 420 29,8 3 926 4 436 54,6 17 20 0,22003 8 213 8 910 1 262 1 369 15,4 2 492 2 703 30,3 4 443 4 820 54,1 16 17 0,22004 8 946 9 329 1 428 1 489 16,0 2 642 2 755 29,5 4 865 5 073 54,4 12 12 0,12005 10 197 10 197 1 738 1 738 17,0 2 960 2 960 29,0 5 485 5 485 53,8 14 14 0,12006 11 815 11 347 1 971 1 893 16,7 3 266 3 136 27,6 6 558 6 298 55,5 21 20 0,22007 13 342 12 400 2 349 2 183 17,6 3 519 3 270 26,4 7 454 6 927 55,9 21 20 0,22008 14 701 13 342 2 672 2 425 18,2 3 932 3 569 26,7 8 074 7 327 54,9 23 21 0,22009 14 582 13 154 2 927 2 640 20,1 4 058 3 661 27,8 7 568 6 827 51,9 29 26 0,22010 14 588 13 034 2 931 2 618 20,1 4 123 3 684 28,3 7 506 6 707 51,5 28 25 0,2Fu<strong>en</strong>te: “Estadística sobre las actividades <strong>en</strong> Investigación Ci<strong>en</strong>tífica y Desarrollo Tecnológico (I+D). Indicadores básicos 2010”. INE (2011), “Main Sci<strong>en</strong>ce and Technology Indicators. Volume2011/2”. OCDE (<strong>2012</strong>), y elaboración propia. Último acceso: abril <strong>2012</strong>.Tabla 3. <strong>España</strong>. Gasto interno total <strong>en</strong> I+D, por habitante y <strong>en</strong> porc<strong>en</strong>taje del PIB, por sector de ejecución (2000-2010)AñosGasto total/Población(euros por habitante)Gastos <strong>en</strong> I+D como porc<strong>en</strong>taje del PIBTotal Administración Pública Enseñanza superior Empresas e IPSFL1995 (a) 89,5 0,81 0,15 0,26 0,402000 (b) 139,1 0,91 0,14 0,27 0,502001 (b) 155,3 0,95 0,15 0,28 0,532002 (b) 168,4 0,99 0,15 0,29 0,542003 (b) 190,1 1,05 0,16 0,32 0,572004 (b) 202,8 1,06 0,17 0,31 0,582005 (b) 228,1 1,12 0,19 0,33 0,612006 (b) 261,4 1,20 0,20 0,33 0,672007 (b) 289,1 1,27 0,22 0,33 0,712008 (c) 314,5 1,35 0,25 0,36 0,742009 (c) 310,1 1,39 0,28 0,39 0,722010 (c) 309,1 1,39 0,28 0,39 0,72(a) PIB base 1995.(b) PIB base 2000.(c) PIB base 2008.Fu<strong>en</strong>te: “Estadística sobre las actividades <strong>en</strong> Investigación Ci<strong>en</strong>tífica y Desarrollo Tecnológico (I+D). Indicadores básicos 2010”. INE (2011), "Padrón Municipal". INE (2011) y elaboraciónpropia. Último acceso: abril <strong>2012</strong>.Página 162
- Page 1:
INFORMECOTEC2012
- Page 5 and 6:
© Copyright:Fundación Cotec para
- Page 7 and 8:
El reto de la formación profesiona
- Page 12 and 13:
ContenidoLos informes anuales Cotec
- Page 14:
1Primera parte: Análisis de la sit
- Page 17 and 18:
Principales indicadores y referenci
- Page 19 and 20:
Principales indicadores y referenci
- Page 21 and 22:
I. Tecnología y competitividadGrá
- Page 23 and 24:
I. Tecnología y competitividadGrá
- Page 25 and 26:
I. Tecnología y competitividadGrá
- Page 27 and 28:
I. Tecnología y competitividadGrá
- Page 29 and 30:
I. Tecnología y competitividadGrá
- Page 31 and 32:
I. Tecnología y competitividadsupe
- Page 33 and 34:
I. Tecnología y competitividadGrá
- Page 35 and 36:
I. Tecnología y competitividadGrá
- Page 37 and 38:
I. Tecnología y competitividadPág
- Page 40:
I. Tecnología y competitividadGrá
- Page 43 and 44:
I. Tecnología y competitividadGrá
- Page 45 and 46:
I. Tecnología y competitividadTabl
- Page 47 and 48:
I. Tecnología y competitividadEl
- Page 49 and 50:
I. Tecnología y competitividadPág
- Page 51 and 52:
I. Tecnología y competitividadCuad
- Page 53 and 54:
I. Tecnología y competitividadGrá
- Page 55 and 56:
I. Tecnología y competitividadTabl
- Page 57 and 58:
I. Tecnología y competitividadPág
- Page 59 and 60:
I. Tecnología y competitividadRusi
- Page 61 and 62:
I. Tecnología y competitividadFund
- Page 63 and 64:
I. Tecnología y competitividady re
- Page 65 and 66:
II. Innovación, sociedad y pymesP
- Page 67 and 68:
II. Innovación, sociedad y pymes
- Page 69 and 70:
II. Innovación, sociedad y pymesP
- Page 71 and 72:
II. Innovación, sociedad y pymesTa
- Page 73 and 74:
II. Innovación, sociedad y pymesdi
- Page 75 and 76:
II. Innovación, sociedad y pymesLa
- Page 77 and 78:
II. Innovación, sociedad y pymesin
- Page 79 and 80:
II. Innovación, sociedad y pymesci
- Page 81 and 82:
II. Innovación, sociedad y pymesMu
- Page 83 and 84:
II. Innovación, sociedad y pymespu
- Page 85 and 86:
II. Innovación, sociedad y pymesP
- Page 87 and 88:
II. Innovación, sociedad y pymesP
- Page 89 and 90:
III. Tecnología y empresaGráfico
- Page 91 and 92:
III. Tecnología y empresaGráfico
- Page 93 and 94:
III. Tecnología y empresaGráfico
- Page 95 and 96:
III. Tecnología y empresalo que re
- Page 97 and 98:
III. Tecnología y empresaPágina 9
- Page 99 and 100:
III. Tecnología y empresaEl repart
- Page 101 and 102:
III. Tecnología y empresaEn 2010 (
- Page 103 and 104:
III. Tecnología y empresaes de des
- Page 105 and 106:
III. Tecnología y empresaSiguen en
- Page 107 and 108:
IV. Políticas de ejecución y fina
- Page 109 and 110: IV. Políticas de ejecución y fina
- Page 111 and 112: IV. Políticas de ejecución y fina
- Page 113 and 114: IV. Políticas de ejecución y fina
- Page 115 and 116: IV. Políticas de ejecución y fina
- Page 117 and 118: IV. Políticas de ejecución y fina
- Page 119 and 120: IV. Políticas de ejecución y fina
- Page 121 and 122: IV. Políticas de ejecución y fina
- Page 123 and 124: IV. Políticas de ejecución y fina
- Page 125 and 126: IV. Políticas de ejecución y fina
- Page 127 and 128: IV. Políticas de ejecución y fina
- Page 129 and 130: IV. Políticas de ejecución y fina
- Page 131 and 132: IV. Políticas de ejecución y fina
- Page 133 and 134: IV. Políticas de ejecución y fina
- Page 135 and 136: IV. Políticas de ejecución y fina
- Page 137 and 138: V. Opiniones de expertos sobre la e
- Page 139 and 140: V. Opiniones de expertos sobre la e
- Page 141 and 142: V. Opiniones de expertos sobre la e
- Page 143 and 144: V. Opiniones de expertos sobre la e
- Page 145 and 146: VI. Panel de innovación tecnológi
- Page 147 and 148: VI. Panel de innovación tecnológi
- Page 149 and 150: VI. Panel de innovación tecnológi
- Page 151 and 152: VI. Panel de innovación tecnológi
- Page 154 and 155: VII. Consideraciones finalesVII.Con
- Page 156 and 157: VII. Consideraciones finalesenergé
- Page 158: 2Segunda parte: Información numér
- Page 163 and 164: VIII. Información numéricaTabla 5
- Page 165 and 166: VIII. Información numéricaTabla 7
- Page 167 and 168: VIII. Información numéricaTabla 9
- Page 169 and 170: VIII. Información numéricaTabla 1
- Page 171 and 172: VIII. Información numéricaTabla 1
- Page 173 and 174: VIII. Información numéricaTabla 1
- Page 175 and 176: VIII. Información numéricaTabla 2
- Page 177 and 178: VIII. Información numéricaTabla 2
- Page 179 and 180: VIII. Información numéricaActivid
- Page 181 and 182: VIII. Información numéricaTabla 3
- Page 183 and 184: VIII. Información numéricaRecurso
- Page 185 and 186: VIII. Información numéricaRecurso
- Page 187 and 188: VIII. Información numéricaTabla 4
- Page 189 and 190: VIII. Información numéricaTabla 4
- Page 191 and 192: VIII. Información numéricaProducc
- Page 193 and 194: VIII. Información numéricaTabla 5
- Page 195 and 196: VIII. Información numéricaPatente
- Page 197 and 198: VIII. Información numéricaTabla 5
- Page 199 and 200: VIII. Información numéricaTabla 5
- Page 201 and 202: VIII. Información numéricaTabla 6
- Page 203 and 204: VIII. Información numéricaPresupu
- Page 206 and 207: I. Elaboración de un índice Cotec
- Page 208 and 209: I. Elaboración de un índice Cotec
- Page 210:
II. Índice de cuadrosII.Índice de
- Page 213 and 214:
III. Índice de tablas13 España. E
- Page 216 and 217:
IV. Índice de gráficosIV.Índice
- Page 218:
IV. Índice de gráficosIII.12 Peso
- Page 221 and 222:
V. Siglas y acrónimosIPRDerechos d
- Page 223 and 224:
VI. BibliografíaUK Department for
- Page 226:
Cotec es unafundación de origenemp