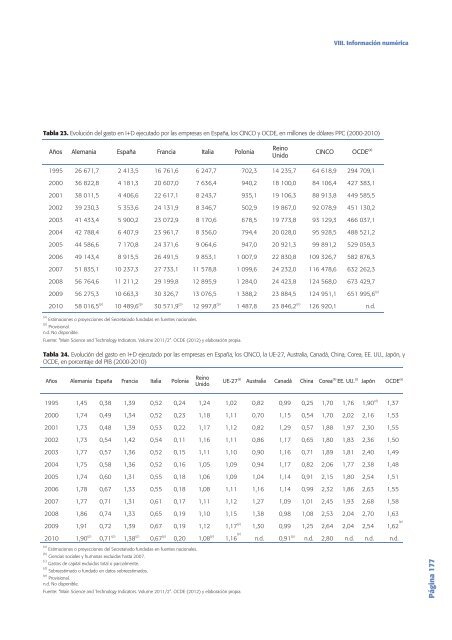
VIII. Información numéricaTabla 23. Evolución del gasto <strong>en</strong> I+D ejecutado por las empresas <strong>en</strong> <strong>España</strong>, los CINCO y OCDE, <strong>en</strong> millones de dólares PPC (2000-2010)Años Alemania <strong>España</strong> Francia Italia PoloniaReinoUnidoCINCOOCDE (a)1995 26 671,7 2 413,5 16 761,6 6 247,7 702,3 14 235,7 64 618,9 294 709,12000 36 822,8 4 181,3 20 607,0 7 636,4 940,2 18 100,0 84 106,4 427 383,12001 38 011,5 4 406,6 22 617,1 8 243,7 935,1 19 106,3 88 913,8 449 585,52002 39 230,3 5 353,6 24 131,9 8 346,7 502,9 19 867,0 92 078,9 451 130,22003 41 433,4 5 900,2 23 072,9 8 170,6 678,5 19 773,8 93 129,3 466 037,12004 42 788,4 6 407,9 23 961,7 8 356,0 794,4 20 028,0 95 928,5 488 521,22005 44 586,6 7 170,8 24 371,6 9 064,6 947,0 20 921,3 99 891,2 529 059,32006 49 143,4 8 915,5 26 491,5 9 853,1 1 007,9 22 830,8 109 326,7 582 876,32007 51 835,1 10 237,3 27 733,1 11 578,8 1 099,6 24 232,0 116 478,6 632 262,32008 56 764,6 11 211,2 29 199,8 12 895,9 1 284,0 24 423,8 124 568,0 673 429,72009 56 275,3 10 663,3 30 326,7 13 076,5 1 388,2 23 884,5 124 951,1 651 995,6 (p)2010 58 016,5 (p) 10 489,6 (p) 30 571,9 (p) 12 997,8 (p) 1 487,8 23 846,2 (p) 126 920,1 n.d.(a) Estimaciones o proyecciones del Secretariado fundadas <strong>en</strong> fu<strong>en</strong>tes nacionales.(p) Provisional.n.d. No disponible.Fu<strong>en</strong>te: “Main Sci<strong>en</strong>ce and Technology Indicators. Volume 2011/2”. OCDE (<strong>2012</strong>) y elaboración propia.Tabla 24. Evolución del gasto <strong>en</strong> I+D ejecutado por las empresas <strong>en</strong> <strong>España</strong>, los CINCO, la UE-27, Australia, Canadá, China, Corea, EE. UU., Japón, yOCDE, <strong>en</strong> porc<strong>en</strong>taje del PIB (2000-2010)Años Alemania <strong>España</strong> Francia Italia PoloniaReinoUnidoUE-27 (a) Australia Canadá China Corea (b) EE. UU. (c) Japón OCDE (a)1995 1,45 0,38 1,39 0,52 0,24 1,24 1,02 0,82 0,99 0,25 1,70 1,76 1,90 (d) 1,372000 1,74 0,49 1,34 0,52 0,23 1,18 1,11 0,70 1,15 0,54 1,70 2,02 2,16 1,532001 1,73 0,48 1,39 0,53 0,22 1,17 1,12 0,82 1,29 0,57 1,88 1,97 2,30 1,552002 1,73 0,54 1,42 0,54 0,11 1,16 1,11 0,86 1,17 0,65 1,80 1,83 2,36 1,502003 1,77 0,57 1,36 0,52 0,15 1,11 1,10 0,90 1,16 0,71 1,89 1,81 2,40 1,492004 1,75 0,58 1,36 0,52 0,16 1,05 1,09 0,94 1,17 0,82 2,06 1,77 2,38 1,482005 1,74 0,60 1,31 0,55 0,18 1,06 1,09 1,04 1,14 0,91 2,15 1,80 2,54 1,512006 1,78 0,67 1,33 0,55 0,18 1,08 1,11 1,16 1,14 0,99 2,32 1,86 2,63 1,552007 1,77 0,71 1,31 0,61 0,17 1,11 1,12 1,27 1,09 1,01 2,45 1,93 2,68 1,582008 1,86 0,74 1,33 0,65 0,19 1,10 1,15 1,38 0,98 1,08 2,53 2,04 2,70 1,632009 1,91 0,72 1,39 0,67 0,19 1,12 1,17 (p) 1,30 0,99 1,25 2,64 2,04 2,54 1,62 (p)2010 1,90 (p) 0,71 (p) 1,38 (p) 0,67 (p) 0,20 1,08 (p) 1,16 (p) n.d. 0,91 (p) n.d. 2,80 n.d. n.d. n.d.(a) Estimaciones o proyecciones del Secretariado fundadas <strong>en</strong> fu<strong>en</strong>tes nacionales.(b) Ci<strong>en</strong>cias sociales y humanas excluidas hasta 2007.(c) Gastos de capital excluidos total o parcialm<strong>en</strong>te.(d) Sobreestimado o fundado <strong>en</strong> datos sobreestimados.(p) Provisional.n.d. No disponible.Fu<strong>en</strong>te: “Main Sci<strong>en</strong>ce and Technology Indicators. Volume 2011/2”. OCDE (<strong>2012</strong>) y elaboración propia.Página 177
VIII. Información numéricaTabla 25. Gasto empresarial de I+D por segm<strong>en</strong>tos de tamaño <strong>en</strong> <strong>España</strong>, los CINCO, Australia, Canadá, Corea, Estados Unidos y Japón, 2009(<strong>en</strong> millones de dólares PPC)Número deempleadosAlemania <strong>España</strong> Francia Italia (b) PoloniaReinoUnidoAustralia Canadá (a) Corea EE. UU. (d) Japón (c)0 0 0 16 222 1701-9336 567 710 126 192 688 605 50210-491 665 2 136 2 115 878 76 684 1 291 1 834 3 810 21 48750-2494 196 2 750 3 663 1 514 257 3 016 1 671 2 310 4 651 26 029 6 539250-4992 912 1 146 2 366 937 264 2 111 1 090 1 090 1 987 11 204500-9993 342 892 1 724 379 1 137 1 205 1 765 10 119 9 674>=50047 166 4 063 21 472 8 123 775 17 865 6 544 24 078 223 673>=100043 824 3 171 6 399 396 5 407 5 581 22 313 213 554 87 616TOTAL 56 275 10 663 30 327 11 579 1 388 23 884 11 506 12 793 35 028 282 393 104 032(a) Año 2008(b) Año 2007(c) Dato estimado a la baja(d) Excluye la mayoría o todos los gastos de capital"Fu<strong>en</strong>te: “OECD Sci<strong>en</strong>ce, Technology and R&D Statistics”. OCDE (<strong>2012</strong>) y elaboración propia." Último acceso: abril <strong>2012</strong>.Tabla 26. Gasto <strong>en</strong> I+D ejecutado por el sector público <strong>en</strong> <strong>España</strong>, los CINCO y la OCDE, <strong>en</strong> millones de dólares PPC (2000-2010)Años Alemania <strong>España</strong> Francia Italia Polonia Reino Unido CINCO OCDE (b)1995 13 569,9 2 534,4 10 361,1 5 450,4 1 110,8 7 402,4 37 894,7 135 883,52000 15 534,9 3 540,5 11 892,1 7 614,8 1 661,8 9 256,3 45 959,8 170 822,52001 16 394,5 3 938,2 12 677,9 8 553,6 1 670,1 9 543,6 48 839,8 184 368,72002 17 426,7 4 431,1 13 503,9 8 702,2 1 962,3 10 173,4 51 768,5 197 435,42003 17 987,4 4 984,4 13 280,7 8 876,6 1 791,5 10 688,4 52 624,6 206 233,02004 18 519,2 5 359,8 13 522,5 8 853,3 1 965,6 11 342,1 54 202,7 215 963,22005 19 712,2 6 141,9 14 358,9 8 553,5 2 026,1 12 369,6 57 020,4 230 330,52006 21 057,0 7 119,5 14 993,3 9 589,6 2 174,4 13 373,8 61 188,1 244 190,62007 22 220,9 8 058,5 15 786,0 9 968,1 2 511,7 13 656,8 64 143,5 259 227,22008 25 206,1 9 171,5 16 766,9 10 399,0 2 863,3 14 045,1 69 280,4 274 289,22009 27 021,9 9 842,5 18 227,0 10 647,8 3 476,9 14 672,5 74 046,1 290 508,9 (p)2010 28 193,2 (a) 9 856,8 (P) 18 827,9 (P) 10 490,2 (p) 4 084,0 14 343,9 (p) 75 939,2 n.d.(a) Estimación o proyección nacional.(b) Estimaciones o proyecciones del Secretariado fundadas <strong>en</strong> fu<strong>en</strong>tes nacionales.(p) Dato provisional.n.d. No disponible.Fu<strong>en</strong>te: “Main Sci<strong>en</strong>ce & Technology Indicators. Volume 2011/2”. OCDE (<strong>2012</strong>) y elaboración propia.Página 178
- Page 1:
INFORMECOTEC2012
- Page 5 and 6:
© Copyright:Fundación Cotec para
- Page 7 and 8:
El reto de la formación profesiona
- Page 12 and 13:
ContenidoLos informes anuales Cotec
- Page 14:
1Primera parte: Análisis de la sit
- Page 17 and 18:
Principales indicadores y referenci
- Page 19 and 20:
Principales indicadores y referenci
- Page 21 and 22:
I. Tecnología y competitividadGrá
- Page 23 and 24:
I. Tecnología y competitividadGrá
- Page 25 and 26:
I. Tecnología y competitividadGrá
- Page 27 and 28:
I. Tecnología y competitividadGrá
- Page 29 and 30:
I. Tecnología y competitividadGrá
- Page 31 and 32:
I. Tecnología y competitividadsupe
- Page 33 and 34:
I. Tecnología y competitividadGrá
- Page 35 and 36:
I. Tecnología y competitividadGrá
- Page 37 and 38:
I. Tecnología y competitividadPág
- Page 40:
I. Tecnología y competitividadGrá
- Page 43 and 44:
I. Tecnología y competitividadGrá
- Page 45 and 46:
I. Tecnología y competitividadTabl
- Page 47 and 48:
I. Tecnología y competitividadEl
- Page 49 and 50:
I. Tecnología y competitividadPág
- Page 51 and 52:
I. Tecnología y competitividadCuad
- Page 53 and 54:
I. Tecnología y competitividadGrá
- Page 55 and 56:
I. Tecnología y competitividadTabl
- Page 57 and 58:
I. Tecnología y competitividadPág
- Page 59 and 60:
I. Tecnología y competitividadRusi
- Page 61 and 62:
I. Tecnología y competitividadFund
- Page 63 and 64:
I. Tecnología y competitividady re
- Page 65 and 66:
II. Innovación, sociedad y pymesP
- Page 67 and 68:
II. Innovación, sociedad y pymes
- Page 69 and 70:
II. Innovación, sociedad y pymesP
- Page 71 and 72:
II. Innovación, sociedad y pymesTa
- Page 73 and 74:
II. Innovación, sociedad y pymesdi
- Page 75 and 76:
II. Innovación, sociedad y pymesLa
- Page 77 and 78:
II. Innovación, sociedad y pymesin
- Page 79 and 80:
II. Innovación, sociedad y pymesci
- Page 81 and 82:
II. Innovación, sociedad y pymesMu
- Page 83 and 84:
II. Innovación, sociedad y pymespu
- Page 85 and 86:
II. Innovación, sociedad y pymesP
- Page 87 and 88:
II. Innovación, sociedad y pymesP
- Page 89 and 90:
III. Tecnología y empresaGráfico
- Page 91 and 92:
III. Tecnología y empresaGráfico
- Page 93 and 94:
III. Tecnología y empresaGráfico
- Page 95 and 96:
III. Tecnología y empresalo que re
- Page 97 and 98:
III. Tecnología y empresaPágina 9
- Page 99 and 100:
III. Tecnología y empresaEl repart
- Page 101 and 102:
III. Tecnología y empresaEn 2010 (
- Page 103 and 104:
III. Tecnología y empresaes de des
- Page 105 and 106:
III. Tecnología y empresaSiguen en
- Page 107 and 108:
IV. Políticas de ejecución y fina
- Page 109 and 110:
IV. Políticas de ejecución y fina
- Page 111 and 112:
IV. Políticas de ejecución y fina
- Page 113 and 114:
IV. Políticas de ejecución y fina
- Page 115 and 116:
IV. Políticas de ejecución y fina
- Page 117 and 118:
IV. Políticas de ejecución y fina
- Page 119 and 120:
IV. Políticas de ejecución y fina
- Page 121 and 122:
IV. Políticas de ejecución y fina
- Page 123 and 124:
IV. Políticas de ejecución y fina
- Page 125 and 126: IV. Políticas de ejecución y fina
- Page 127 and 128: IV. Políticas de ejecución y fina
- Page 129 and 130: IV. Políticas de ejecución y fina
- Page 131 and 132: IV. Políticas de ejecución y fina
- Page 133 and 134: IV. Políticas de ejecución y fina
- Page 135 and 136: IV. Políticas de ejecución y fina
- Page 137 and 138: V. Opiniones de expertos sobre la e
- Page 139 and 140: V. Opiniones de expertos sobre la e
- Page 141 and 142: V. Opiniones de expertos sobre la e
- Page 143 and 144: V. Opiniones de expertos sobre la e
- Page 145 and 146: VI. Panel de innovación tecnológi
- Page 147 and 148: VI. Panel de innovación tecnológi
- Page 149 and 150: VI. Panel de innovación tecnológi
- Page 151 and 152: VI. Panel de innovación tecnológi
- Page 154 and 155: VII. Consideraciones finalesVII.Con
- Page 156 and 157: VII. Consideraciones finalesenergé
- Page 158: 2Segunda parte: Información numér
- Page 161 and 162: VIII. Información numéricaGasto e
- Page 163 and 164: VIII. Información numéricaTabla 5
- Page 165 and 166: VIII. Información numéricaTabla 7
- Page 167 and 168: VIII. Información numéricaTabla 9
- Page 169 and 170: VIII. Información numéricaTabla 1
- Page 171 and 172: VIII. Información numéricaTabla 1
- Page 173 and 174: VIII. Información numéricaTabla 1
- Page 175: VIII. Información numéricaTabla 2
- Page 179 and 180: VIII. Información numéricaActivid
- Page 181 and 182: VIII. Información numéricaTabla 3
- Page 183 and 184: VIII. Información numéricaRecurso
- Page 185 and 186: VIII. Información numéricaRecurso
- Page 187 and 188: VIII. Información numéricaTabla 4
- Page 189 and 190: VIII. Información numéricaTabla 4
- Page 191 and 192: VIII. Información numéricaProducc
- Page 193 and 194: VIII. Información numéricaTabla 5
- Page 195 and 196: VIII. Información numéricaPatente
- Page 197 and 198: VIII. Información numéricaTabla 5
- Page 199 and 200: VIII. Información numéricaTabla 5
- Page 201 and 202: VIII. Información numéricaTabla 6
- Page 203 and 204: VIII. Información numéricaPresupu
- Page 206 and 207: I. Elaboración de un índice Cotec
- Page 208 and 209: I. Elaboración de un índice Cotec
- Page 210: II. Índice de cuadrosII.Índice de
- Page 213 and 214: III. Índice de tablas13 España. E
- Page 216 and 217: IV. Índice de gráficosIV.Índice
- Page 218: IV. Índice de gráficosIII.12 Peso
- Page 221 and 222: V. Siglas y acrónimosIPRDerechos d
- Page 223 and 224: VI. BibliografíaUK Department for
- Page 226:
Cotec es unafundación de origenemp