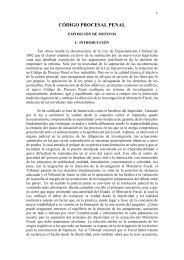
VIII. Información numéricaTabla 6. <strong>España</strong>. Gasto total <strong>en</strong> I+D <strong>en</strong> porc<strong>en</strong>taje del PIB regional por comunidades autónomas, PIB base 2000 (2000-2010)ComunidadesautónomasGasto total <strong>en</strong> I+D <strong>en</strong> porc<strong>en</strong>taje del PIB regionalPIB percápita(euros)Personal deI+D/1.000ocupados1995 2000 2001 2002 2003 2004 2005 2006 2007 2008 (a) 2009 (a) 2010 (a) 2010 (a) 2010Andalucía 0,57 0,65 0,60 0,60 0,85 0,76 0,84 0,89 1,02 1,03 1,10 1,20 17 428 9,01Castilla-La Mancha 0,42 0,56 0,34 0,43 0,42 0,41 0,41 0,47 0,60 0,68 0,63 0,68 18 338 4,59Extremadura 0,28 0,54 0,59 0,59 0,62 0,41 0,68 0,72 0,74 0,89 0,90 0,88 16 014 6,31Galicia 0,47 0,64 0,72 0,79 0,85 0,85 0,87 0,89 1,03 1,01 0,93 0,94 20 709 9,82Regiones deconverg<strong>en</strong>cia0,51 0,62 0,59 0,61 0,77 0,71 0,77 0,82 0,94 0,97 0,98 1,05 18 088 8,31Aragón 0,60 0,69 0,69 0,71 0,70 0,69 0,79 0,87 0,90 1,02 1,12 1,15 25 322 12,90Asturias 0,53 0,82 0,69 0,62 0,67 0,65 0,70 0,88 0,92 0,97 1,01 1,05 21 477 9,36Baleares 0,16 0,22 0,23 0,24 0,24 0,26 0,27 0,29 0,33 0,36 0,38 0,42 24 111 4,54Canarias 0,42 0,47 0,54 0,58 0,52 0,58 0,58 0,65 0,64 0,64 0,59 0,63 19 281 5,31Cantabria 0,54 0,46 0,57 0,53 0,45 0,44 0,45 0,79 0,88 1,06 1,17 1,22 22 309 8,87Castilla y León 0,49 0,64 0,82 0,80 0,86 0,93 0,89 0,97 1,10 1,31 1,15 1,09 22 355 9,76Cataluña 0,89 1,06 1,10 1,19 1,27 1,33 1,35 1,42 1,48 1,64 1,70 1,65 26 675 14,77Ceuta y Melilla 0,00 0,00 0,00 0,04 0,07 0,10 0,13 0,19 0,20 0,22 0,22 0,12 19 415 0,82Com. Val<strong>en</strong>ciana 0,49 0,71 0,74 0,77 0,83 0,89 0,98 0,95 0,95 1,04 1,11 1,07 20 260 10,21Madrid 1,61 1,58 1,67 1,76 1,69 1,64 1,81 1,96 1,92 2,02 2,06 2,07 29 351 19,03Murcia 0,49 0,69 0,62 0,54 0,68 0,65 0,73 0,76 0,91 0,84 0,87 0,92 19 073 10,67Navarra 0,73 0,87 1,16 1,05 1,34 1,80 1,68 1,91 1,88 1,96 2,19 2,02 29 197 19,25País Vasco 1,14 1,16 1,36 1,29 1,39 1,51 1,48 1,58 1,87 2,03 2,12 2,03 30 152 18,02La Rioja 0,34 0,57 0,62 0,54 0,63 0,66 0,66 1,04 1,16 0,98 1,08 1,06 25 328 10,93Regiones de noconverg<strong>en</strong>cia0,89 1,00 1,07 1,10 1,14 1,18 1,23 1,32 1,37 1,48 1,52 1,50 24 878 13,45<strong>España</strong> 0,81 0,91 0,95 0,99 1,05 1,06 1,12 1,20 1,27 1,35 1,39 1,39 22 819 12,03(a) PIB base 2008.Fu<strong>en</strong>te: “Estadística sobre las actividades <strong>en</strong> Investigación Ci<strong>en</strong>tífica y Desarrollo Tecnológico (I+D). Indicadores básicos 2010” y "Contabilidad Regional de <strong>España</strong>". INE (2011) y elaboraciónpropia. Último acceso: abril <strong>2012</strong>.Página 165
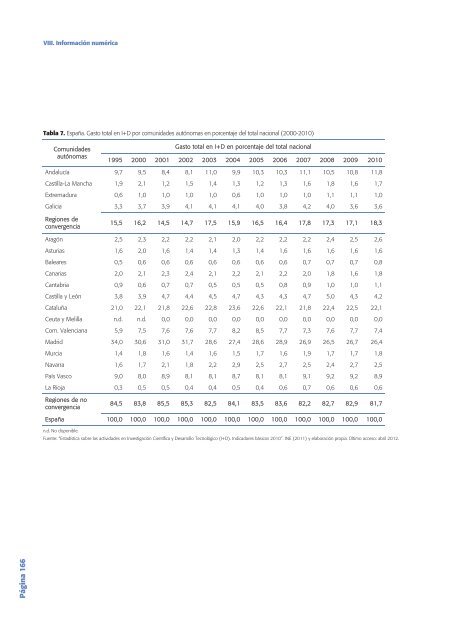
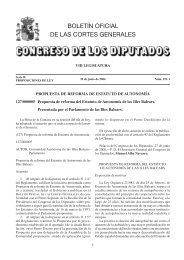
VIII. Información numéricaTabla 7. <strong>España</strong>. Gasto total <strong>en</strong> I+D por comunidades autónomas <strong>en</strong> porc<strong>en</strong>taje del total nacional (2000-2010)ComunidadesautónomasGasto total <strong>en</strong> I+D <strong>en</strong> porc<strong>en</strong>taje del total nacional1995 2000 2001 2002 2003 2004 2005 2006 2007 2008 2009 2010Andalucía 9,7 9,5 8,4 8,1 11,0 9,9 10,3 10,3 11,1 10,5 10,8 11,8Castilla-La Mancha 1,9 2,1 1,2 1,5 1,4 1,3 1,2 1,3 1,6 1,8 1,6 1,7Extremadura 0,6 1,0 1,0 1,0 1,0 0,6 1,0 1,0 1,0 1,1 1,1 1,0Galicia 3,3 3,7 3,9 4,1 4,1 4,1 4,0 3,8 4,2 4,0 3,6 3,6Regiones deconverg<strong>en</strong>cia15,5 16,2 14,5 14,7 17,5 15,9 16,5 16,4 17,8 17,3 17,1 18,3Aragón 2,5 2,3 2,2 2,2 2,1 2,0 2,2 2,2 2,2 2,4 2,5 2,6Asturias 1,6 2,0 1,6 1,4 1,4 1,3 1,4 1,6 1,6 1,6 1,6 1,6Baleares 0,5 0,6 0,6 0,6 0,6 0,6 0,6 0,6 0,7 0,7 0,7 0,8Canarias 2,0 2,1 2,3 2,4 2,1 2,2 2,1 2,2 2,0 1,8 1,6 1,8Cantabria 0,9 0,6 0,7 0,7 0,5 0,5 0,5 0,8 0,9 1,0 1,0 1,1Castilla y León 3,8 3,9 4,7 4,4 4,5 4,7 4,3 4,3 4,7 5,0 4,3 4,2Cataluña 21,0 22,1 21,8 22,6 22,8 23,6 22,6 22,1 21,8 22,4 22,5 22,1Ceuta y Melilla n.d. n.d. 0,0 0,0 0,0 0,0 0,0 0,0 0,0 0,0 0,0 0,0Com. Val<strong>en</strong>ciana 5,9 7,5 7,6 7,6 7,7 8,2 8,5 7,7 7,3 7,6 7,7 7,4Madrid 34,0 30,6 31,0 31,7 28,6 27,4 28,6 28,9 26,9 26,5 26,7 26,4Murcia 1,4 1,8 1,6 1,4 1,6 1,5 1,7 1,6 1,9 1,7 1,7 1,8Navarra 1,6 1,7 2,1 1,8 2,2 2,9 2,5 2,7 2,5 2,4 2,7 2,5País Vasco 9,0 8,0 8,9 8,1 8,1 8,7 8,1 8,1 9,1 9,2 9,2 8,9La Rioja 0,3 0,5 0,5 0,4 0,4 0,5 0,4 0,6 0,7 0,6 0,6 0,6Regiones de noconverg<strong>en</strong>cia84,5 83,8 85,5 85,3 82,5 84,1 83,5 83,6 82,2 82,7 82,9 81,7<strong>España</strong> 100,0 100,0 100,0 100,0 100,0 100,0 100,0 100,0 100,0 100,0 100,0 100,0n.d. No disponible.Fu<strong>en</strong>te: “Estadística sobre las actividades <strong>en</strong> Investigación Ci<strong>en</strong>tífica y Desarrollo Tecnológico (I+D). Indicadores básicos 2010”. INE (2011) y elaboración propia. Último acceso: abril <strong>2012</strong>.Página 166
- Page 1:
INFORMECOTEC2012
- Page 5 and 6:
© Copyright:Fundación Cotec para
- Page 7 and 8:
El reto de la formación profesiona
- Page 12 and 13:
ContenidoLos informes anuales Cotec
- Page 14:
1Primera parte: Análisis de la sit
- Page 17 and 18:
Principales indicadores y referenci
- Page 19 and 20:
Principales indicadores y referenci
- Page 21 and 22:
I. Tecnología y competitividadGrá
- Page 23 and 24:
I. Tecnología y competitividadGrá
- Page 25 and 26:
I. Tecnología y competitividadGrá
- Page 27 and 28:
I. Tecnología y competitividadGrá
- Page 29 and 30:
I. Tecnología y competitividadGrá
- Page 31 and 32:
I. Tecnología y competitividadsupe
- Page 33 and 34:
I. Tecnología y competitividadGrá
- Page 35 and 36:
I. Tecnología y competitividadGrá
- Page 37 and 38:
I. Tecnología y competitividadPág
- Page 40:
I. Tecnología y competitividadGrá
- Page 43 and 44:
I. Tecnología y competitividadGrá
- Page 45 and 46:
I. Tecnología y competitividadTabl
- Page 47 and 48:
I. Tecnología y competitividadEl
- Page 49 and 50:
I. Tecnología y competitividadPág
- Page 51 and 52:
I. Tecnología y competitividadCuad
- Page 53 and 54:
I. Tecnología y competitividadGrá
- Page 55 and 56:
I. Tecnología y competitividadTabl
- Page 57 and 58:
I. Tecnología y competitividadPág
- Page 59 and 60:
I. Tecnología y competitividadRusi
- Page 61 and 62:
I. Tecnología y competitividadFund
- Page 63 and 64:
I. Tecnología y competitividady re
- Page 65 and 66:
II. Innovación, sociedad y pymesP
- Page 67 and 68:
II. Innovación, sociedad y pymes
- Page 69 and 70:
II. Innovación, sociedad y pymesP
- Page 71 and 72:
II. Innovación, sociedad y pymesTa
- Page 73 and 74:
II. Innovación, sociedad y pymesdi
- Page 75 and 76:
II. Innovación, sociedad y pymesLa
- Page 77 and 78:
II. Innovación, sociedad y pymesin
- Page 79 and 80:
II. Innovación, sociedad y pymesci
- Page 81 and 82:
II. Innovación, sociedad y pymesMu
- Page 83 and 84:
II. Innovación, sociedad y pymespu
- Page 85 and 86:
II. Innovación, sociedad y pymesP
- Page 87 and 88:
II. Innovación, sociedad y pymesP
- Page 89 and 90:
III. Tecnología y empresaGráfico
- Page 91 and 92:
III. Tecnología y empresaGráfico
- Page 93 and 94:
III. Tecnología y empresaGráfico
- Page 95 and 96:
III. Tecnología y empresalo que re
- Page 97 and 98:
III. Tecnología y empresaPágina 9
- Page 99 and 100:
III. Tecnología y empresaEl repart
- Page 101 and 102:
III. Tecnología y empresaEn 2010 (
- Page 103 and 104:
III. Tecnología y empresaes de des
- Page 105 and 106:
III. Tecnología y empresaSiguen en
- Page 107 and 108:
IV. Políticas de ejecución y fina
- Page 109 and 110:
IV. Políticas de ejecución y fina
- Page 111 and 112:
IV. Políticas de ejecución y fina
- Page 113 and 114: IV. Políticas de ejecución y fina
- Page 115 and 116: IV. Políticas de ejecución y fina
- Page 117 and 118: IV. Políticas de ejecución y fina
- Page 119 and 120: IV. Políticas de ejecución y fina
- Page 121 and 122: IV. Políticas de ejecución y fina
- Page 123 and 124: IV. Políticas de ejecución y fina
- Page 125 and 126: IV. Políticas de ejecución y fina
- Page 127 and 128: IV. Políticas de ejecución y fina
- Page 129 and 130: IV. Políticas de ejecución y fina
- Page 131 and 132: IV. Políticas de ejecución y fina
- Page 133 and 134: IV. Políticas de ejecución y fina
- Page 135 and 136: IV. Políticas de ejecución y fina
- Page 137 and 138: V. Opiniones de expertos sobre la e
- Page 139 and 140: V. Opiniones de expertos sobre la e
- Page 141 and 142: V. Opiniones de expertos sobre la e
- Page 143 and 144: V. Opiniones de expertos sobre la e
- Page 145 and 146: VI. Panel de innovación tecnológi
- Page 147 and 148: VI. Panel de innovación tecnológi
- Page 149 and 150: VI. Panel de innovación tecnológi
- Page 151 and 152: VI. Panel de innovación tecnológi
- Page 154 and 155: VII. Consideraciones finalesVII.Con
- Page 156 and 157: VII. Consideraciones finalesenergé
- Page 158: 2Segunda parte: Información numér
- Page 161 and 162: VIII. Información numéricaGasto e
- Page 163: VIII. Información numéricaTabla 5
- Page 167 and 168: VIII. Información numéricaTabla 9
- Page 169 and 170: VIII. Información numéricaTabla 1
- Page 171 and 172: VIII. Información numéricaTabla 1
- Page 173 and 174: VIII. Información numéricaTabla 1
- Page 175 and 176: VIII. Información numéricaTabla 2
- Page 177 and 178: VIII. Información numéricaTabla 2
- Page 179 and 180: VIII. Información numéricaActivid
- Page 181 and 182: VIII. Información numéricaTabla 3
- Page 183 and 184: VIII. Información numéricaRecurso
- Page 185 and 186: VIII. Información numéricaRecurso
- Page 187 and 188: VIII. Información numéricaTabla 4
- Page 189 and 190: VIII. Información numéricaTabla 4
- Page 191 and 192: VIII. Información numéricaProducc
- Page 193 and 194: VIII. Información numéricaTabla 5
- Page 195 and 196: VIII. Información numéricaPatente
- Page 197 and 198: VIII. Información numéricaTabla 5
- Page 199 and 200: VIII. Información numéricaTabla 5
- Page 201 and 202: VIII. Información numéricaTabla 6
- Page 203 and 204: VIII. Información numéricaPresupu
- Page 206 and 207: I. Elaboración de un índice Cotec
- Page 208 and 209: I. Elaboración de un índice Cotec
- Page 210: II. Índice de cuadrosII.Índice de
- Page 213 and 214: III. Índice de tablas13 España. E
- Page 216 and 217:
IV. Índice de gráficosIV.Índice
- Page 218:
IV. Índice de gráficosIII.12 Peso
- Page 221 and 222:
V. Siglas y acrónimosIPRDerechos d
- Page 223 and 224:
VI. BibliografíaUK Department for
- Page 226:
Cotec es unafundación de origenemp