- Page 1:
INFORMECOTEC2012
- Page 5 and 6:
© Copyright:Fundación Cotec para
- Page 7 and 8:
El reto de la formación profesiona
- Page 12 and 13:
ContenidoLos informes anuales Cotec
- Page 14:
1Primera parte: Análisis de la sit
- Page 17 and 18:
Principales indicadores y referenci
- Page 19 and 20:
Principales indicadores y referenci
- Page 21 and 22:
I. Tecnología y competitividadGrá
- Page 23 and 24:
I. Tecnología y competitividadGrá
- Page 25 and 26:
I. Tecnología y competitividadGrá
- Page 27 and 28:
I. Tecnología y competitividadGrá
- Page 29 and 30:
I. Tecnología y competitividadGrá
- Page 31 and 32:
I. Tecnología y competitividadsupe
- Page 33 and 34:
I. Tecnología y competitividadGrá
- Page 35 and 36:
I. Tecnología y competitividadGrá
- Page 37 and 38:
I. Tecnología y competitividadPág
- Page 40:
I. Tecnología y competitividadGrá
- Page 43 and 44:
I. Tecnología y competitividadGrá
- Page 45 and 46:
I. Tecnología y competitividadTabl
- Page 47 and 48:
I. Tecnología y competitividadEl
- Page 49 and 50:
I. Tecnología y competitividadPág
- Page 51 and 52:
I. Tecnología y competitividadCuad
- Page 53 and 54:
I. Tecnología y competitividadGrá
- Page 55 and 56:
I. Tecnología y competitividadTabl
- Page 57 and 58:
I. Tecnología y competitividadPág
- Page 59 and 60:
I. Tecnología y competitividadRusi
- Page 61 and 62:
I. Tecnología y competitividadFund
- Page 63 and 64:
I. Tecnología y competitividady re
- Page 65 and 66:
II. Innovación, sociedad y pymesP
- Page 67 and 68:
II. Innovación, sociedad y pymes
- Page 69 and 70:
II. Innovación, sociedad y pymesP
- Page 71 and 72:
II. Innovación, sociedad y pymesTa
- Page 73 and 74:
II. Innovación, sociedad y pymesdi
- Page 75 and 76:
II. Innovación, sociedad y pymesLa
- Page 77 and 78:
II. Innovación, sociedad y pymesin
- Page 79 and 80:
II. Innovación, sociedad y pymesci
- Page 81 and 82:
II. Innovación, sociedad y pymesMu
- Page 83 and 84:
II. Innovación, sociedad y pymespu
- Page 85 and 86:
II. Innovación, sociedad y pymesP
- Page 87 and 88:
II. Innovación, sociedad y pymesP
- Page 89 and 90:
III. Tecnología y empresaGráfico
- Page 91 and 92:
III. Tecnología y empresaGráfico
- Page 93 and 94:
III. Tecnología y empresaGráfico
- Page 95 and 96:
III. Tecnología y empresalo que re
- Page 97 and 98:
III. Tecnología y empresaPágina 9
- Page 99 and 100:
III. Tecnología y empresaEl repart
- Page 101 and 102:
III. Tecnología y empresaEn 2010 (
- Page 103 and 104:
III. Tecnología y empresaes de des
- Page 105 and 106:
III. Tecnología y empresaSiguen en
- Page 107 and 108:
IV. Políticas de ejecución y fina
- Page 109 and 110:
IV. Políticas de ejecución y fina
- Page 111 and 112: IV. Políticas de ejecución y fina
- Page 113 and 114: IV. Políticas de ejecución y fina
- Page 115 and 116: IV. Políticas de ejecución y fina
- Page 117 and 118: IV. Políticas de ejecución y fina
- Page 119 and 120: IV. Políticas de ejecución y fina
- Page 121 and 122: IV. Políticas de ejecución y fina
- Page 123 and 124: IV. Políticas de ejecución y fina
- Page 125 and 126: IV. Políticas de ejecución y fina
- Page 127 and 128: IV. Políticas de ejecución y fina
- Page 129 and 130: IV. Políticas de ejecución y fina
- Page 131 and 132: IV. Políticas de ejecución y fina
- Page 133 and 134: IV. Políticas de ejecución y fina
- Page 135 and 136: IV. Políticas de ejecución y fina
- Page 137 and 138: V. Opiniones de expertos sobre la e
- Page 139 and 140: V. Opiniones de expertos sobre la e
- Page 141 and 142: V. Opiniones de expertos sobre la e
- Page 143 and 144: V. Opiniones de expertos sobre la e
- Page 145 and 146: VI. Panel de innovación tecnológi
- Page 147 and 148: VI. Panel de innovación tecnológi
- Page 149 and 150: VI. Panel de innovación tecnológi
- Page 151 and 152: VI. Panel de innovación tecnológi
- Page 154 and 155: VII. Consideraciones finalesVII.Con
- Page 156 and 157: VII. Consideraciones finalesenergé
- Page 158: 2Segunda parte: Información numér
- Page 161: VIII. Información numéricaGasto e
- Page 165 and 166: VIII. Información numéricaTabla 7
- Page 167 and 168: VIII. Información numéricaTabla 9
- Page 169 and 170: VIII. Información numéricaTabla 1
- Page 171 and 172: VIII. Información numéricaTabla 1
- Page 173 and 174: VIII. Información numéricaTabla 1
- Page 175 and 176: VIII. Información numéricaTabla 2
- Page 177 and 178: VIII. Información numéricaTabla 2
- Page 179 and 180: VIII. Información numéricaActivid
- Page 181 and 182: VIII. Información numéricaTabla 3
- Page 183 and 184: VIII. Información numéricaRecurso
- Page 185 and 186: VIII. Información numéricaRecurso
- Page 187 and 188: VIII. Información numéricaTabla 4
- Page 189 and 190: VIII. Información numéricaTabla 4
- Page 191 and 192: VIII. Información numéricaProducc
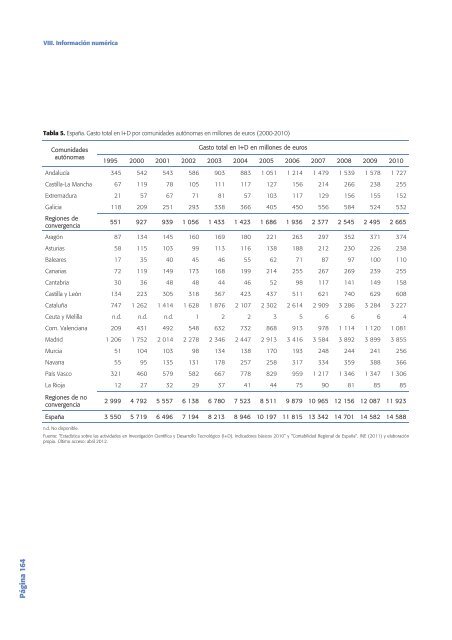
- Page 193 and 194: VIII. Información numéricaTabla 5
- Page 195 and 196: VIII. Información numéricaPatente
- Page 197 and 198: VIII. Información numéricaTabla 5
- Page 199 and 200: VIII. Información numéricaTabla 5
- Page 201 and 202: VIII. Información numéricaTabla 6
- Page 203 and 204: VIII. Información numéricaPresupu
- Page 206 and 207: I. Elaboración de un índice Cotec
- Page 208 and 209: I. Elaboración de un índice Cotec
- Page 210: II. Índice de cuadrosII.Índice de
- Page 213 and 214:
III. Índice de tablas13 España. E
- Page 216 and 217:
IV. Índice de gráficosIV.Índice
- Page 218:
IV. Índice de gráficosIII.12 Peso
- Page 221 and 222:
V. Siglas y acrónimosIPRDerechos d
- Page 223 and 224:
VI. BibliografíaUK Department for
- Page 226:
Cotec es unafundación de origenemp