VIII. Información numéricaTabla 38. Evolución del número de investigadores (<strong>en</strong> EJC) <strong>en</strong> <strong>España</strong> y los CINCO (2000-2010)Años Alemania <strong>España</strong> Francia Italia Polonia Reino Unido1995 231 128 47 342 151 249 75 536 50 425 145 6732000 257 874 76 670 172 070 66 110 55 174 170 554 (a)2001 264 385 80 081 177 372 66 702 56 148 182 144 (a)2002 265 812 83 318 186 420 71 242 56 725 198 163 (a)2003 268 942 92 523 192 790 70 332 58 595 216 690 (a)2004 270 215 100 994 202 377 72 012 60 944 228 969 (a)2005 272 148 109 720 202 507 82 489 62 162 248 599 (b)2006 279 822 115 798 210 591 88 430 59 573 254 009 (b)2007 290 853 122 624 221 851 93 000 61 395 252 651 (b)2008 302 467 130 986 229 130 n.d. 61 805 251 932 (b)2009 317 226 133 803 234 201 101 825 61 105 256 124 (b)2010 327 500 (b) 134 653 (p) n.d. 105 846 (p) 64 511 235 373 (p)(a) Estimaciones o proyecciones del Secretariado fundadas <strong>en</strong> fu<strong>en</strong>tes nacionales.(b) Estimación o proyección nacional.(p) Provisional.n.d. No disponible.Fu<strong>en</strong>te: “Main Sci<strong>en</strong>ce and Technology Indicators. Volume 2011/2”. OCDE (<strong>2012</strong>) y elaboración propia.Tabla 39. Evolución del número de investigadores (<strong>en</strong> EJC) sobre el total del personal de I+D (<strong>en</strong> EJC) <strong>en</strong> <strong>España</strong> y los CINCO (2000-2010)Años Alemania <strong>España</strong> Francia Italia Polonia Reino Unido1995 50,3 59,2 47,5 53,3 60,3 52,62000 53,2 63,6 52,5 44,1 69,9 59,12001 55,0 63,7 53,2 43,3 72,7 60,92002 55,4 62,1 54,9 43,4 74,4 64,22003 56,9 61,1 56,3 43,5 76,1 68,62004 57,4 62,4 57,5 43,9 77,8 71,82005 57,3 62,8 57,9 47,1 81,0 76,52006 57,3 61,3 57,6 46,1 81,0 75,92007 57,4 61,0 58,5 44,6 81,5 73,52008 57,9 60,7 59,6 n.d. 82,9 73,62009 59,3 60,6 60,0 45,0 83,0 73,72010 59,5 60,6 n.d. 48,4 78,8 73,7n.d. No disponibleFu<strong>en</strong>te: “Main Sci<strong>en</strong>ce and Technology Indicators. Volume 2011/2”. OCDE (<strong>2012</strong>) y elaboración propia.Página 187
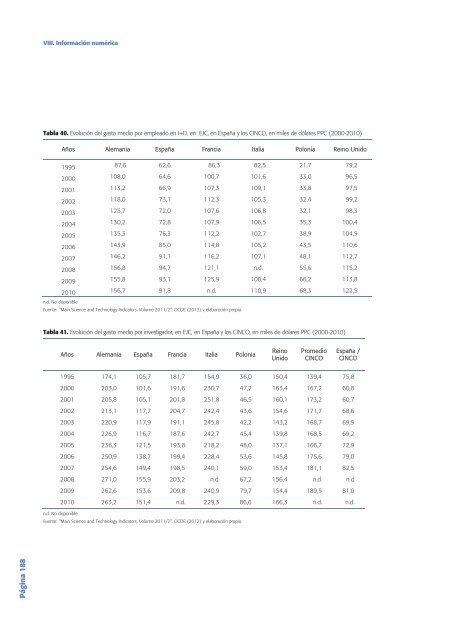
VIII. Información numéricaTabla 40. Evolución del gasto medio por empleado <strong>en</strong> I+D, <strong>en</strong> EJC, <strong>en</strong> <strong>España</strong> y los CINCO, <strong>en</strong> miles de dólares PPC (2000-2010)Años Alemania <strong>España</strong> Francia Italia Polonia Reino Unido1995 87,6 62,6 86,3 82,5 21,7 79,22000 108,0 64,6 100,7 101,6 33,0 96,52001 113,2 66,9 107,3 109,1 33,8 97,52002 118,0 73,1 112,3 105,3 32,4 99,22003 125,7 72,0 107,6 106,8 32,1 98,32004 130,2 72,8 107,9 106,5 35,3 100,42005 135,3 76,3 112,2 102,7 38,9 104,92006 143,9 85,0 114,8 105,2 43,5 110,62007 146,2 91,1 116,2 107,1 48,1 112,72008 156,8 94,7 121,1 n.d. 55,6 115,22009 155,8 93,1 125,9 108,4 66,2 113,82010 156,7 91,8 n.d. 110,9 68,3 122,5n.d. No disponibleFu<strong>en</strong>te: “Main Sci<strong>en</strong>ce and Technology Indicators. Volume 2011/2”. OCDE (<strong>2012</strong>) y elaboración propia.Tabla 41. Evolución del gasto medio por investigador, <strong>en</strong> EJC, <strong>en</strong> <strong>España</strong> y los CINCO, <strong>en</strong> miles de dólares PPC (2000-2010)Años Alemania <strong>España</strong> Francia Italia PoloniaReinoUnidoPromedioCINCO<strong>España</strong> /CINCO1995 174,1 105,7 181,7 154,9 36,0 150,4 139,4 75,82000 203,0 101,6 191,6 230,7 47,2 163,4 167,2 60,82001 205,8 105,1 201,8 251,8 46,5 160,1 173,2 60,72002 213,1 117,7 204,7 242,4 43,6 154,6 171,7 68,62003 220,9 117,9 191,1 245,8 42,2 143,2 168,7 69,92004 226,9 116,7 187,6 242,7 45,4 139,8 168,5 69,22005 236,3 121,5 193,8 218,2 48,0 137,1 166,7 72,92006 250,9 138,7 199,4 228,4 53,6 145,8 175,6 79,02007 254,6 149,4 198,5 240,1 59,0 153,4 181,1 82,52008 271,0 155,9 203,2 n.d. 67,2 156,4 n.d. n.d.2009 262,6 153,6 209,8 240,9 79,7 154,4 189,5 81,02010 263,2 151,4 n.d. 229,3 86,6 166,3 n.d. n.d.n.d. No disponible.Fu<strong>en</strong>te: “Main Sci<strong>en</strong>ce and Technology Indicators. Volume 2011/2”. OCDE (<strong>2012</strong>) y elaboración propia.Página 188
- Page 1:
INFORMECOTEC2012
- Page 5 and 6:
© Copyright:Fundación Cotec para
- Page 7 and 8:
El reto de la formación profesiona
- Page 12 and 13:
ContenidoLos informes anuales Cotec
- Page 14:
1Primera parte: Análisis de la sit
- Page 17 and 18:
Principales indicadores y referenci
- Page 19 and 20:
Principales indicadores y referenci
- Page 21 and 22:
I. Tecnología y competitividadGrá
- Page 23 and 24:
I. Tecnología y competitividadGrá
- Page 25 and 26:
I. Tecnología y competitividadGrá
- Page 27 and 28:
I. Tecnología y competitividadGrá
- Page 29 and 30:
I. Tecnología y competitividadGrá
- Page 31 and 32:
I. Tecnología y competitividadsupe
- Page 33 and 34:
I. Tecnología y competitividadGrá
- Page 35 and 36:
I. Tecnología y competitividadGrá
- Page 37 and 38:
I. Tecnología y competitividadPág
- Page 40:
I. Tecnología y competitividadGrá
- Page 43 and 44:
I. Tecnología y competitividadGrá
- Page 45 and 46:
I. Tecnología y competitividadTabl
- Page 47 and 48:
I. Tecnología y competitividadEl
- Page 49 and 50:
I. Tecnología y competitividadPág
- Page 51 and 52:
I. Tecnología y competitividadCuad
- Page 53 and 54:
I. Tecnología y competitividadGrá
- Page 55 and 56:
I. Tecnología y competitividadTabl
- Page 57 and 58:
I. Tecnología y competitividadPág
- Page 59 and 60:
I. Tecnología y competitividadRusi
- Page 61 and 62:
I. Tecnología y competitividadFund
- Page 63 and 64:
I. Tecnología y competitividady re
- Page 65 and 66:
II. Innovación, sociedad y pymesP
- Page 67 and 68:
II. Innovación, sociedad y pymes
- Page 69 and 70:
II. Innovación, sociedad y pymesP
- Page 71 and 72:
II. Innovación, sociedad y pymesTa
- Page 73 and 74:
II. Innovación, sociedad y pymesdi
- Page 75 and 76:
II. Innovación, sociedad y pymesLa
- Page 77 and 78:
II. Innovación, sociedad y pymesin
- Page 79 and 80:
II. Innovación, sociedad y pymesci
- Page 81 and 82:
II. Innovación, sociedad y pymesMu
- Page 83 and 84:
II. Innovación, sociedad y pymespu
- Page 85 and 86:
II. Innovación, sociedad y pymesP
- Page 87 and 88:
II. Innovación, sociedad y pymesP
- Page 89 and 90:
III. Tecnología y empresaGráfico
- Page 91 and 92:
III. Tecnología y empresaGráfico
- Page 93 and 94:
III. Tecnología y empresaGráfico
- Page 95 and 96:
III. Tecnología y empresalo que re
- Page 97 and 98:
III. Tecnología y empresaPágina 9
- Page 99 and 100:
III. Tecnología y empresaEl repart
- Page 101 and 102:
III. Tecnología y empresaEn 2010 (
- Page 103 and 104:
III. Tecnología y empresaes de des
- Page 105 and 106:
III. Tecnología y empresaSiguen en
- Page 107 and 108:
IV. Políticas de ejecución y fina
- Page 109 and 110:
IV. Políticas de ejecución y fina
- Page 111 and 112:
IV. Políticas de ejecución y fina
- Page 113 and 114:
IV. Políticas de ejecución y fina
- Page 115 and 116:
IV. Políticas de ejecución y fina
- Page 117 and 118:
IV. Políticas de ejecución y fina
- Page 119 and 120:
IV. Políticas de ejecución y fina
- Page 121 and 122:
IV. Políticas de ejecución y fina
- Page 123 and 124:
IV. Políticas de ejecución y fina
- Page 125 and 126:
IV. Políticas de ejecución y fina
- Page 127 and 128:
IV. Políticas de ejecución y fina
- Page 129 and 130:
IV. Políticas de ejecución y fina
- Page 131 and 132:
IV. Políticas de ejecución y fina
- Page 133 and 134:
IV. Políticas de ejecución y fina
- Page 135 and 136: IV. Políticas de ejecución y fina
- Page 137 and 138: V. Opiniones de expertos sobre la e
- Page 139 and 140: V. Opiniones de expertos sobre la e
- Page 141 and 142: V. Opiniones de expertos sobre la e
- Page 143 and 144: V. Opiniones de expertos sobre la e
- Page 145 and 146: VI. Panel de innovación tecnológi
- Page 147 and 148: VI. Panel de innovación tecnológi
- Page 149 and 150: VI. Panel de innovación tecnológi
- Page 151 and 152: VI. Panel de innovación tecnológi
- Page 154 and 155: VII. Consideraciones finalesVII.Con
- Page 156 and 157: VII. Consideraciones finalesenergé
- Page 158: 2Segunda parte: Información numér
- Page 161 and 162: VIII. Información numéricaGasto e
- Page 163 and 164: VIII. Información numéricaTabla 5
- Page 165 and 166: VIII. Información numéricaTabla 7
- Page 167 and 168: VIII. Información numéricaTabla 9
- Page 169 and 170: VIII. Información numéricaTabla 1
- Page 171 and 172: VIII. Información numéricaTabla 1
- Page 173 and 174: VIII. Información numéricaTabla 1
- Page 175 and 176: VIII. Información numéricaTabla 2
- Page 177 and 178: VIII. Información numéricaTabla 2
- Page 179 and 180: VIII. Información numéricaActivid
- Page 181 and 182: VIII. Información numéricaTabla 3
- Page 183 and 184: VIII. Información numéricaRecurso
- Page 185: VIII. Información numéricaRecurso
- Page 189 and 190: VIII. Información numéricaTabla 4
- Page 191 and 192: VIII. Información numéricaProducc
- Page 193 and 194: VIII. Información numéricaTabla 5
- Page 195 and 196: VIII. Información numéricaPatente
- Page 197 and 198: VIII. Información numéricaTabla 5
- Page 199 and 200: VIII. Información numéricaTabla 5
- Page 201 and 202: VIII. Información numéricaTabla 6
- Page 203 and 204: VIII. Información numéricaPresupu
- Page 206 and 207: I. Elaboración de un índice Cotec
- Page 208 and 209: I. Elaboración de un índice Cotec
- Page 210: II. Índice de cuadrosII.Índice de
- Page 213 and 214: III. Índice de tablas13 España. E
- Page 216 and 217: IV. Índice de gráficosIV.Índice
- Page 218: IV. Índice de gráficosIII.12 Peso
- Page 221 and 222: V. Siglas y acrónimosIPRDerechos d
- Page 223 and 224: VI. BibliografíaUK Department for
- Page 226: Cotec es unafundación de origenemp