- Page 1 and 2:
ThesedeDoctoratdel'ObservatoiredePa
- Page 3 and 4:
Remerciements.La fin de cette thès
- Page 6 and 7:
Table des matièresIntroduction gé
- Page 8 and 9:
3.1. Résultats des modèles. . . .
- Page 10 and 11:
2. Réponse de la Terre à une char
- Page 12 and 13:
GPS Global Positioning System.HOB2
- Page 14 and 15:
INTRODUCTIONINTRODUCTION GÉNÉRALE
- Page 16: INTRODUCTIONments sur la stabilité
- Page 20 and 21: CHAPITRE IDONNÉES GÉNÉRALES SUR
- Page 22 and 23: x1. LA GÉOGRAPHIE DE L’ANTARCTIQ
- Page 24 and 25: x1. LA GÉOGRAPHIE DE L’ANTARCTIQ
- Page 26 and 27: x1. LA GÉOGRAPHIE DE L’ANTARCTIQ
- Page 28 and 29: x3. GÉOLOGIE ET GÉOPHYSIQUE.balay
- Page 30 and 31: x3. GÉOLOGIE ET GÉOPHYSIQUE.- Sur
- Page 32 and 33: x4. LA DÉCOUVERTE DE L’ANTARCTIQ
- Page 34 and 35: x4. LA DÉCOUVERTE DE L’ANTARCTIQ
- Page 36 and 37: x4. LA DÉCOUVERTE DE L’ANTARCTIQ
- Page 38 and 39: CHAPITRE IIL’ISOSTASIE APPLIQUÉE
- Page 40 and 41: x1. L’ISOSTASIE TERRESTRE ET SON
- Page 42 and 43: affectés par la réponse terrestre
- Page 44 and 45: x1. L’ISOSTASIE TERRESTRE ET SON
- Page 46 and 47: x1. L’ISOSTASIE TERRESTRE ET SON
- Page 48 and 49: x2. MODÈLES DE DÉGLACIATION ET CA
- Page 50 and 51: x2. MODÈLES DE DÉGLACIATION ET CA
- Page 52 and 53: x2. MODÈLES DE DÉGLACIATION ET CA
- Page 54 and 55: x2. MODÈLES DE DÉGLACIATION ET CA
- Page 56 and 57: x2. MODÈLES DE DÉGLACIATION ET CA
- Page 58 and 59: x2. MODÈLES DE DÉGLACIATION ET CA
- Page 60 and 61: x2. MODÈLES DE DÉGLACIATION ET CA
- Page 62 and 63: x2. MODÈLES DE DÉGLACIATION ET CA
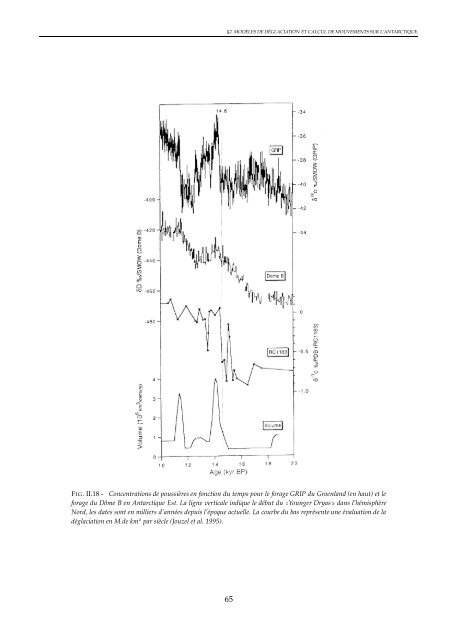
- Page 64 and 65: x2. MODÈLES DE DÉGLACIATION ET CA
- Page 68 and 69: x3. LE CAS PARTICULIER DE L’ANTAR
- Page 70 and 71: x3. LE CAS PARTICULIER DE L’ANTAR
- Page 72 and 73: x3. LE CAS PARTICULIER DE L’ANTAR
- Page 74 and 75: x3. LE CAS PARTICULIER DE L’ANTAR
- Page 76 and 77: x3. LE CAS PARTICULIER DE L’ANTAR
- Page 78 and 79: x3. LE CAS PARTICULIER DE L’ANTAR
- Page 80 and 81: x3. LE CAS PARTICULIER DE L’ANTAR
- Page 82 and 83: x3. LE CAS PARTICULIER DE L’ANTAR
- Page 84 and 85: x4. CONCLUSION.4. Conclusion.On a p
- Page 86 and 87: CHAPITRE IIICOMPORTEMENT ACTUEL DE
- Page 88 and 89: x1. LES TENDANCES ACTUELLES DE L’
- Page 90 and 91: x1. LES TENDANCES ACTUELLES DE L’
- Page 92 and 93: x1. LES TENDANCES ACTUELLES DE L’
- Page 94 and 95: x1. LES TENDANCES ACTUELLES DE L’
- Page 96 and 97: x1. LES TENDANCES ACTUELLES DE L’
- Page 98 and 99: x2. BILAN ACTUEL DE L’ÉQUILIBRE
- Page 100 and 101: _x2. BILAN ACTUEL DE L’ÉQUILIBRE
- Page 102 and 103: x2. BILAN ACTUEL DE L’ÉQUILIBRE
- Page 104 and 105: x3. LA RÉPONSE ÉLASTIQUE DU SOL A
- Page 106 and 107: _hTAB. III.8 - Vitesses élastiques
- Page 108 and 109: x4. UNE ALTERNATIVE : LES MODÈLES
- Page 110 and 111: x4. UNE ALTERNATIVE : LES MODÈLES
- Page 112 and 113: x4. UNE ALTERNATIVE : LES MODÈLES
- Page 114 and 115: x4. UNE ALTERNATIVE : LES MODÈLES
- Page 116 and 117:
d dt=du dt6;5d(gm)Ordx4. UNE ALTERN
- Page 118:
x5. CONCLUSION.ley estime que la te
- Page 121 and 122:
CHAPITRE IV. MOUVEMENTS NE PROVENAN
- Page 123 and 124:
CHAPITRE IV. MOUVEMENTS NE PROVENAN
- Page 125 and 126:
CHAPITRE IV. MOUVEMENTS NE PROVENAN
- Page 127 and 128:
CHAPITRE IV. MOUVEMENTS NE PROVENAN
- Page 130 and 131:
CHAPITRE ISPÉCIFICITÉS DU TRAITEM
- Page 132 and 133:
x1. GÉOMÉTRIE DU RÉSEAU.du trait
- Page 134 and 135:
x2. LES ORBITES DES SATELLITES GPS
- Page 136 and 137:
x2. LES ORBITES DES SATELLITES GPS
- Page 138 and 139:
x2. LES ORBITES DES SATELLITES GPS
- Page 140 and 141:
x3. ACTIVITÉ IONOSPHÉRIQUE.quanti
- Page 142 and 143:
x3. ACTIVITÉ IONOSPHÉRIQUE.TAB. I
- Page 144 and 145:
x4. L’EFFET DE LA NEIGE SUR LE GP
- Page 146 and 147:
x4. L’EFFET DE LA NEIGE SUR LE GP
- Page 148 and 149:
x5. CONCLUSION.5. Conclusion.Traite
- Page 150 and 151:
CHAPITRE IILE TRAITEMENT DES DONNÉ
- Page 152 and 153:
x1. DONNÉES GPS DISPONIBLES.0˚330
- Page 154 and 155:
x1. DONNÉES GPS DISPONIBLES.DUM1MA
- Page 156 and 157:
x2. CALCUL SUR LES STATIONS IGS ANT
- Page 158 and 159:
x2. CALCUL SUR LES STATIONS IGS ANT
- Page 160 and 161:
x2. CALCUL SUR LES STATIONS IGS ANT
- Page 162 and 163:
x2. CALCUL SUR LES STATIONS IGS ANT
- Page 164 and 165:
x2. CALCUL SUR LES STATIONS IGS ANT
- Page 166 and 167:
x2. CALCUL SUR LES STATIONS IGS ANT
- Page 168 and 169:
x2. CALCUL SUR LES STATIONS IGS ANT
- Page 170 and 171:
x3. CALCUL EN RÉSEAU ÉLARGI.3. Ca
- Page 172 and 173:
x3. CALCUL EN RÉSEAU ÉLARGI.exist
- Page 174 and 175:
x3. CALCUL EN RÉSEAU ÉLARGI.TAB.
- Page 176 and 177:
x3. CALCUL EN RÉSEAU ÉLARGI.5040N
- Page 178 and 179:
x3. CALCUL EN RÉSEAU ÉLARGI.97, a
- Page 180 and 181:
x3. CALCUL EN RÉSEAU ÉLARGI.Latit
- Page 182 and 183:
x3. CALCUL EN RÉSEAU ÉLARGI.Casey
- Page 184:
x4. CONCLUSION.particulièrement im
- Page 187 and 188:
CHAPITRE III. ANALYSE GÉODÉSIQUE
- Page 189 and 190:
CHAPITRE III. ANALYSE GÉODÉSIQUE
- Page 191 and 192:
CHAPITRE III. ANALYSE GÉODÉSIQUE
- Page 193 and 194:
CHAPITRE III. ANALYSE GÉODÉSIQUE
- Page 195 and 196:
CHAPITRE III. ANALYSE GÉODÉSIQUE
- Page 197 and 198:
CHAPITRE III. ANALYSE GÉODÉSIQUE
- Page 199 and 200:
CHAPITRE III. ANALYSE GÉODÉSIQUE
- Page 201 and 202:
CHAPITRE III. ANALYSE GÉODÉSIQUE
- Page 203 and 204:
CHAPITRE III. ANALYSE GÉODÉSIQUE
- Page 205 and 206:
CHAPITRE III. ANALYSE GÉODÉSIQUE
- Page 207 and 208:
CHAPITRE III. ANALYSE GÉODÉSIQUE
- Page 209 and 210:
CHAPITRE III. ANALYSE GÉODÉSIQUE
- Page 211 and 212:
CHAPITRE III. ANALYSE GÉODÉSIQUE
- Page 213 and 214:
CHAPITRE III. ANALYSE GÉODÉSIQUE
- Page 215 and 216:
CHAPITRE III. ANALYSE GÉODÉSIQUE
- Page 217 and 218:
CHAPITRE III. ANALYSE GÉODÉSIQUE
- Page 219 and 220:
CHAPITRE III. ANALYSE GÉODÉSIQUE
- Page 221 and 222:
CHAPITRE III. ANALYSE GÉODÉSIQUE
- Page 223 and 224:
CHAPITRE III. ANALYSE GÉODÉSIQUE
- Page 225 and 226:
CHAPITRE IV. INTERPRÉTATION GÉOPH
- Page 227 and 228:
CHAPITRE IV. INTERPRÉTATION GÉOPH
- Page 229 and 230:
CHAPITRE IV. INTERPRÉTATION GÉOPH
- Page 231 and 232:
CHAPITRE IV. INTERPRÉTATION GÉOPH
- Page 233 and 234:
CHAPITRE IV. INTERPRÉTATION GÉOPH
- Page 235 and 236:
CHAPITRE IV. INTERPRÉTATION GÉOPH
- Page 237 and 238:
CHAPITRE IV. INTERPRÉTATION GÉOPH
- Page 239 and 240:
CHAPITRE IV. INTERPRÉTATION GÉOPH
- Page 241 and 242:
CHAPITRE IV. INTERPRÉTATION GÉOPH
- Page 243 and 244:
CHAPITRE IV. INTERPRÉTATION GÉOPH
- Page 245 and 246:
CHAPITRE IV. INTERPRÉTATION GÉOPH
- Page 247 and 248:
CHAPITRE IV. INTERPRÉTATION GÉOPH
- Page 249 and 250:
CHAPITRE IV. INTERPRÉTATION GÉOPH
- Page 251 and 252:
CHAPITRE IV. INTERPRÉTATION GÉOPH
- Page 253 and 254:
CHAPITRE IV. INTERPRÉTATION GÉOPH
- Page 255 and 256:
CHAPITRE IV. INTERPRÉTATION GÉOPH
- Page 257 and 258:
CHAPITRE IV. INTERPRÉTATION GÉOPH
- Page 259 and 260:
CHAPITRE IV. INTERPRÉTATION GÉOPH
- Page 261 and 262:
CHAPITRE IV. INTERPRÉTATION GÉOPH
- Page 263 and 264:
CHAPITRE IV. INTERPRÉTATION GÉOPH
- Page 265 and 266:
CHAPITRE IV. INTERPRÉTATION GÉOPH
- Page 268 and 269:
CONCLUSIONCONCLUSION GÉNÉRALE.Cro
- Page 270 and 271:
CONCLUSIONlongues devraient permett
- Page 272 and 273:
RÉFÉRENCESRéférencesAGNEW, D. C
- Page 274 and 275:
RÉFÉRENCESBUDD, W. F. et I. N. SM
- Page 276 and 277:
RÉFÉRENCESHUGHES, T. J., G. H. DE
- Page 278 and 279:
RÉFÉRENCESLANGBEIN, J. et H. JOHN
- Page 280 and 281:
RÉFÉRENCESOERLEMANS, J. Model exp
- Page 282 and 283:
RÉFÉRENCESSKVARCA, P. Changes and
- Page 284:
RÉFÉRENCESWYATT, F. K. Measuremen
- Page 287 and 288:
parW(;Le formalisme spectral se fon
- Page 289 and 290:
L(0; 0;t0)=X`;mL`m(t0)Y`m(0;ANNEXE
- Page 291 and 292:
(; termen(; ;t)=N`m Xn=1n(; ;t)ANNE
- Page 293 and 294:
oùIICE L`m(t)=wSEO Lǹm=wSn;EO `m(
- Page 295 and 296:
ANNEXE A. CALCUL DE DÉFORMATIONS D
- Page 297 and 298:
ANNEXE B. QUELQUES RAPPELS THÉORIQ
- Page 299 and 300:
t0est le temps d’intégration, o
- Page 301 and 302:
em(t)=Zt =(f0+a)(tt0)+12b(tt0)2+em(
- Page 303 and 304:
Les termes principaux dans l’équ
- Page 305 and 306:
ANNEXE B. QUELQUES RAPPELS THÉORIQ
- Page 307 and 308:
:ai=sin(Elv)=hibi=cos2(Elv)=2ahi A2
- Page 309 and 310:
ANNEXE B. QUELQUES RAPPELS THÉORIQ
- Page 311 and 312:
ANNEXE C. SÉRIES TEMPORELLES ISSUE
- Page 313 and 314:
ANNEXE C. SÉRIES TEMPORELLES ISSUE
- Page 315 and 316:
ANNEXE C. SÉRIES TEMPORELLES ISSUE
- Page 317 and 318:
ANNEXE C. SÉRIES TEMPORELLES ISSUE
- Page 319 and 320:
ANNEXE C. SÉRIES TEMPORELLES ISSUE
- Page 321 and 322:
ANNEXE C. SÉRIES TEMPORELLES ISSUE
- Page 323 and 324:
ANNEXE C. SÉRIES TEMPORELLES ISSUE
- Page 325 and 326:
ANNEXE C. SÉRIES TEMPORELLES ISSUE
- Page 328 and 329:
ANNEXE DCAS PARTICULIER : MESURE PA
- Page 330:
Latitude en m.−21.00−22.00−23