End of Year Report - Richland College
End of Year Report - Richland College
End of Year Report - Richland College

You also want an ePaper? Increase the reach of your titles
YUMPU automatically turns print PDFs into web optimized ePapers that Google loves.
104<br />
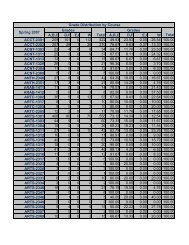
KPI 3.4 Proactively manage turnover and diversity<br />
<strong>Richland</strong> <strong>College</strong><br />
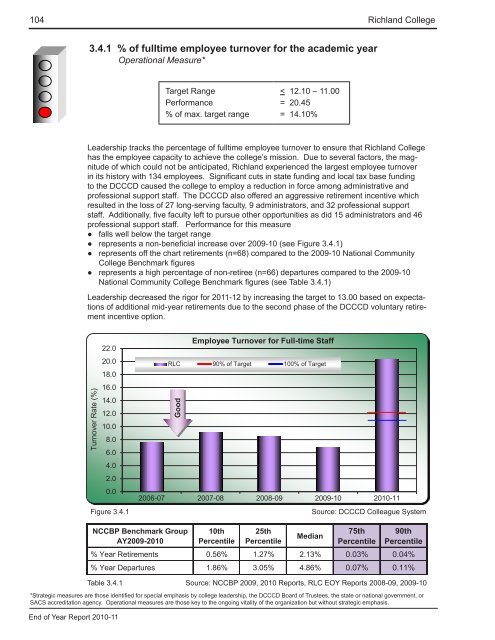
3.4.1 % <strong>of</strong> fulltime employee turnover for the academic year<br />
Operational Measure*<br />
Target Range<br />
Performance<br />
% <strong>of</strong> max. target range<br />
< 12.10 – 11.00<br />
= 20.45<br />
= 14.10%<br />
Leadership tracks the percentage <strong>of</strong> fulltime employee turnover to ensure that <strong>Richland</strong> <strong>College</strong><br />
has the employee capacity to achieve the college’s mission. Due to several factors, the magnitude<br />
<strong>of</strong> which could not be anticipated, <strong>Richland</strong> experienced the largest employee turnover<br />
in its history with 134 employees. Significant cuts in state funding and local tax base funding<br />
to the DCCCD caused the college to employ a reduction in force among administrative and<br />
pr<strong>of</strong>essional support staff. The DCCCD also <strong>of</strong>fered an aggressive retirement incentive which<br />
resulted in the loss <strong>of</strong> 27 long-serving faculty, 9 administrators, and 32 pr<strong>of</strong>essional support<br />
staff. Additionally, five faculty left to pursue other opportunities as did 15 administrators and 46<br />
pr<strong>of</strong>essional support staff. Performance for this measure<br />
●●<br />
falls well below the target range<br />
●●<br />
represents a non-beneficial increase over 2009-10 (see Figure 3.4.1)<br />
●●<br />
represents <strong>of</strong>f the chart retirements (n=68) compared to the 2009-10 National Community<br />
<strong>College</strong> Benchmark figures<br />
●●<br />
represents a high percentage <strong>of</strong> non-retiree (n=66) departures compared to the 2009-10<br />
National Community <strong>College</strong> Benchmark figures (see Table 3.4.1)<br />
Leadership decreased the rigor for 2011-12 by increasing the target to 13.00 based on expectations<br />
<strong>of</strong> additional mid-year retirements due to the second phase <strong>of</strong> the DCCCD voluntary retirement<br />
incentive option.<br />
Turnover Rate (%)<br />
22.0<br />
20.0<br />
18.0<br />
16.0<br />
14.0<br />
12.0<br />
10.0<br />
8.0<br />
6.0<br />
4.0<br />
2.0<br />
0.0<br />
Figure 3.4.1<br />
RLC 90% <strong>of</strong> Target 100% <strong>of</strong> Target<br />
Good<br />
Employee Turnover for Full-time Staff<br />
2006-07 2007-08 2008-09 2009-10 2010-11<br />
Source: DCCCD Colleague System<br />
*Strategic measures are those identified for special emphasis by college leadership, the DCCCD Board <strong>of</strong> Trustees, the state or national government, or<br />
SACS accreditation agency. Operational measures are those key to the ongoing vitality <strong>of</strong> the organization but without strategic emphasis.<br />
<strong>End</strong> <strong>of</strong> <strong>Year</strong> <strong>Report</strong> 2010-11<br />
NCCBP Benchmark Group<br />
AY2009-2010<br />
10th<br />
Percentile<br />
25th<br />
Percentile<br />
Median<br />
75th<br />
Percentile<br />
90th<br />
Percentile<br />
% <strong>Year</strong> Retirements 0.56% 1.27% 2.13% 0.03% 0.04%<br />
% <strong>Year</strong> Departures 1.86% 3.05% 4.86% 0.07% 0.11%<br />
Table 3.4.1<br />
Source: NCCBP 2009, 2010 <strong>Report</strong>s, RLC EOY <strong>Report</strong>s 2008-09, 2009-10