End of Year Report - Richland College
End of Year Report - Richland College
End of Year Report - Richland College

Create successful ePaper yourself
Turn your PDF publications into a flip-book with our unique Google optimized e-Paper software.
<strong>Richland</strong> <strong>College</strong> 83<br />
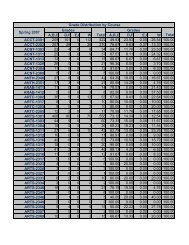
2.1.16 # <strong>of</strong> students completing the core curriculum<br />
Strategic Measure*<br />
Target Range<br />
Performance<br />
% <strong>of</strong> max. target range<br />
≥ 1,305 – 1,450<br />
= 1,294<br />
= 89.20%<br />
2.2.16 # <strong>of</strong> African-American and Hispanic students who complete the<br />
core curriculum<br />
Strategic Measure*<br />
Target Range<br />
Performance<br />
% <strong>of</strong> max. target range<br />
≥ 495 – 550<br />
= 468<br />
= 85.10%<br />
Leadership tracks student completion <strong>of</strong> the core curriculum as a key indicator <strong>of</strong> our students’<br />
abilities to obtain an associate degree and/or to successfully transfer to a university. Performance<br />
for all students who complete the core curriculum<br />
●●<br />
falls just below the target range by 0.80 percentage points<br />
●●<br />
represents a decrease <strong>of</strong> 118 core completers over 2009-10<br />
●●<br />
exceeds that <strong>of</strong> all 6 peers (see Figure 2.1.16A)<br />
●●<br />
represents a 30% DCCCD market share, a decline <strong>of</strong> 2 percentage points over 2009-10<br />
due primarily to growth in completers by Peers 3 and 6 (See Figure 2.1.16B)<br />
Performance for historically underserved students who complete the core curriculum<br />
●●<br />
falls below the target range by 4.9 percentage points<br />
●●<br />
represents a decline <strong>of</strong> decline <strong>of</strong> 57 core completers over 2009-10<br />
●●<br />
exceeds that <strong>of</strong> all 6 peers (see Figure 2.2.16A)<br />
●●<br />
represents a market share <strong>of</strong> 24%, a 2 percent decline over 2009-10 primarily due to<br />
growth in core completers by Peers 2, 4, and 5 (See Figure 2.2.16B)<br />
Leadership left the overall target intact for 2011-12 since it is unclear if or how the institution <strong>of</strong> a<br />
new core curriculum may have affected overall core completion but raised the target for historically<br />
underserved students to 650 based on Achieving the Dream initiative and the state’s Closing the<br />
Gaps mandate.<br />
*Strategic measures are those identified for special emphasis by college leadership, the DCCCD Board <strong>of</strong> Trustees, the state or national government, or<br />
SACS accreditation agency. Operational measures are those key to the ongoing vitality <strong>of</strong> the organization but without strategic emphasis.<br />
<strong>End</strong> <strong>of</strong> <strong>Year</strong> <strong>Report</strong> 2010-11