End of Year Report - Richland College
End of Year Report - Richland College
End of Year Report - Richland College

Create successful ePaper yourself
Turn your PDF publications into a flip-book with our unique Google optimized e-Paper software.
6<br />
<strong>Richland</strong> <strong>College</strong><br />
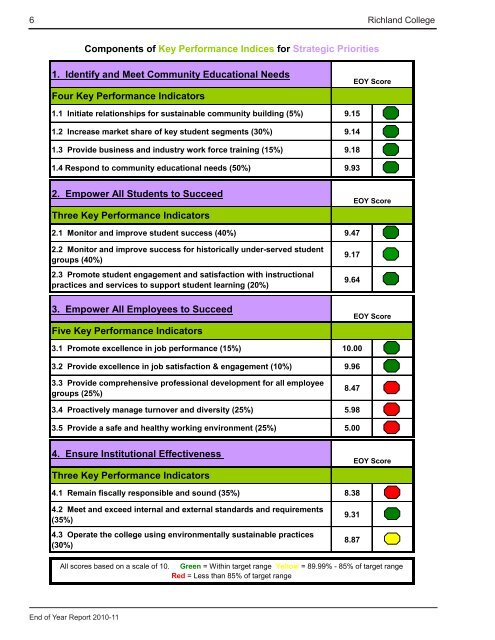
Components <strong>of</strong> Key Performance Indices for Strategic Priorities<br />
1. Identify and Meet Community Educational Needs<br />
Four Key Performance Indicators<br />
EOY Score<br />
1.1 Initiate relationships for sustainable community building (5%) 9.15<br />
1.2 Increase market share <strong>of</strong> key student segments (30%) 9.14<br />
1.3 Provide business and industry work force training (15%) 9.18<br />
1.4 Respond to community educational needs (50%) 9.93<br />
2. Empower All Students to Succeed<br />
Three Key Performance Indicators<br />
EOY Score<br />
2.1 Monitor and improve student success (40%) 9.47<br />
2.2 Monitor and improve success for historically under-served student<br />
groups (40%)<br />
2.3 Promote student engagement and satisfaction with instructional<br />
practices and services to support student learning (20%)<br />
9.17<br />
9.64<br />
3. Empower All Employees to Succeed<br />
Five Key Performance Indicators<br />
EOY Score<br />
3.1 Promote excellence in job performance (15%) 10.00<br />
3.2 Provide excellence in job satisfaction & engagement (10%) 9.96<br />
3.3 Provide comprehensive pr<strong>of</strong>essional development for all employee<br />
groups (25%)<br />
8.47<br />
3.4 Proactively manage turnover and diversity (25%) 5.98<br />
3.5 Provide a safe and healthy working environment (25%) 5.00<br />
4. Ensure Institutional Effectiveness<br />
Three Key Performance Indicators<br />
EOY Score<br />
4.1 Remain fiscally responsible and sound (35%) 8.38<br />
4.2 Meet and exceed internal and external standards and requirements<br />
(35%)<br />
4.3 Operate the college using environmentally sustainable practices<br />
(30%)<br />
9.31<br />
8.87<br />
All scores based on a scale <strong>of</strong> 10. Green = Within target range Yellow = 89.99% - 85% <strong>of</strong> target range<br />
Red = Less than 85% <strong>of</strong> target range<br />
<strong>End</strong> <strong>of</strong> <strong>Year</strong> <strong>Report</strong> 2010-11<br />
Prepared by the OPRIE Page 2 flv u:\excel\kpi\kpi1011\July_August11.xls