End of Year Report - Richland College
End of Year Report - Richland College
End of Year Report - Richland College

You also want an ePaper? Increase the reach of your titles
YUMPU automatically turns print PDFs into web optimized ePapers that Google loves.
136<br />
<strong>Richland</strong> <strong>College</strong><br />
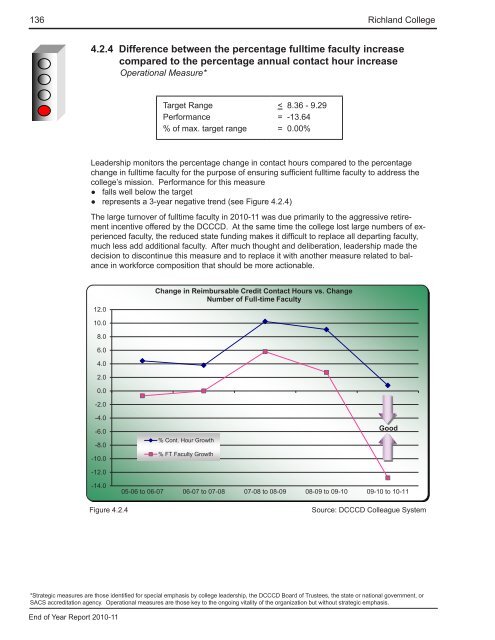
4.2.4 Difference between the percentage fulltime faculty increase<br />
compared to the percentage annual contact hour increase<br />
Operational Measure*<br />
Target Range<br />
Performance<br />
% <strong>of</strong> max. target range<br />
< 8.36 - 9.29<br />
= -13.64<br />
= 0.00%<br />
Leadership monitors the percentage change in contact hours compared to the percentage<br />
change in fulltime faculty for the purpose <strong>of</strong> ensuring sufficient fulltime faculty to address the<br />
college’s mission. Performance for this measure<br />
●●<br />
falls well below the target<br />
●●<br />
represents a 3-year negative trend (see Figure 4.2.4)<br />
The large turnover <strong>of</strong> fulltime faculty in 2010-11 was due primarily to the aggressive retirement<br />
incentive <strong>of</strong>fered by the DCCCD. At the same time the college lost large numbers <strong>of</strong> experienced<br />
faculty, the reduced state funding makes it difficult to replace all departing faculty,<br />
much less add additional faculty. After much thought and deliberation, leadership made the<br />
decision to discontinue this measure and to replace it with another measure related to balance<br />
in workforce composition that should be more actionable.<br />
12.0<br />
Change in Reimbursable Credit Contact Hours vs. Change<br />
Number <strong>of</strong> Full-time Faculty<br />
10.0<br />
8.0<br />
6.0<br />
4.0<br />
2.0<br />
0.0<br />
-2.0<br />
-4.0<br />
-6.0<br />
-8.0<br />
-10.0<br />
-12.0<br />
% Cont. Hour Growth<br />
% FT Faculty Growth<br />
Good<br />
-14.0<br />
05-06 to 06-07 06-07 to 07-08 07-08 to 08-09 08-09 to 09-10 09-10 to 10-11<br />
Figure 4.2.4<br />
Source: DCCCD Colleague System<br />
*Strategic measures are those identified for special emphasis by college leadership, the DCCCD Board <strong>of</strong> Trustees, the state or national government, or<br />
SACS accreditation agency. Operational measures are those key to the ongoing vitality <strong>of</strong> the organization but without strategic emphasis.<br />
<strong>End</strong> <strong>of</strong> <strong>Year</strong> <strong>Report</strong> 2010-11