End of Year Report - Richland College
End of Year Report - Richland College
End of Year Report - Richland College

You also want an ePaper? Increase the reach of your titles
YUMPU automatically turns print PDFs into web optimized ePapers that Google loves.
30<br />
<strong>Richland</strong> <strong>College</strong><br />
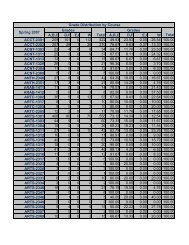
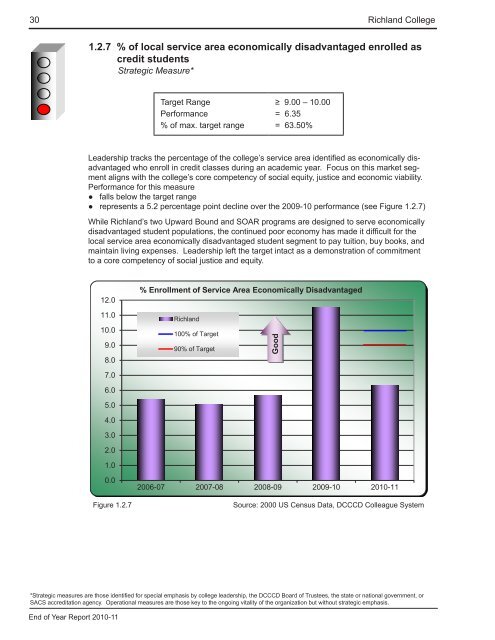
1.2.7 % <strong>of</strong> local service area economically disadvantaged enrolled as<br />
credit students<br />
Strategic Measure*<br />
Target Range<br />
Performance<br />
% <strong>of</strong> max. target range<br />
≥ 9.00 – 10.00<br />
= 6.35<br />
= 63.50%<br />
Leadership tracks the percentage <strong>of</strong> the college’s service area identified as economically disadvantaged<br />
who enroll in credit classes during an academic year. Focus on this market segment<br />
aligns with the college’s core competency <strong>of</strong> social equity, justice and economic viability.<br />
Performance for this measure<br />
●●<br />
falls below the target range<br />
●●<br />
represents a 5.2 percentage point decline over the 2009-10 performance (see Figure 1.2.7)<br />
While <strong>Richland</strong>’s two Upward Bound and SOAR programs are designed to serve economically<br />
disadvantaged student populations, the continued poor economy has made it difficult for the<br />
local service area economically disadvantaged student segment to pay tuition, buy books, and<br />
maintain living expenses. Leadership left the target intact as a demonstration <strong>of</strong> commitment<br />
to a core competency <strong>of</strong> social justice and equity.<br />
12.0<br />
% Enrollment <strong>of</strong> Service Area Economically Disadvantaged<br />
11.0<br />
10.0<br />
9.0<br />
8.0<br />
7.0<br />
6.0<br />
5.0<br />
4.0<br />
3.0<br />
2.0<br />
1.0<br />
<strong>Richland</strong><br />
100% <strong>of</strong> Target<br />
90% <strong>of</strong> Target<br />
Good<br />
0.0<br />
Figure 1.2.7<br />
2006-07 2007-08 2008-09 2009-10 2010-11<br />
Source: 2000 US Census Data, DCCCD Colleague System<br />
*Strategic measures are those identified for special emphasis by college leadership, the DCCCD Board <strong>of</strong> Trustees, the state or national government, or<br />
SACS accreditation agency. Operational measures are those key to the ongoing vitality <strong>of</strong> the organization but without strategic emphasis.<br />
<strong>End</strong> <strong>of</strong> <strong>Year</strong> <strong>Report</strong> 2010-11