End of Year Report - Richland College
End of Year Report - Richland College
End of Year Report - Richland College

You also want an ePaper? Increase the reach of your titles
YUMPU automatically turns print PDFs into web optimized ePapers that Google loves.
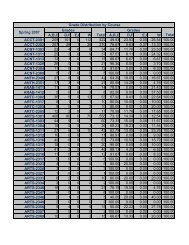
106<br />
<strong>Richland</strong> <strong>College</strong><br />
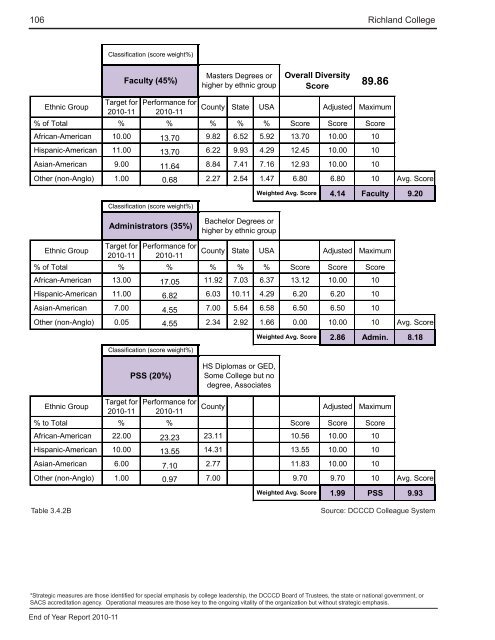
Classification (score weight%)<br />
Faculty (45%)<br />
Masters Degrees or<br />
higher by ethnic group<br />
Overall Diversity<br />
Score<br />
89.86<br />
Ethnic Group<br />
Target for<br />
2010-11<br />
Performance for<br />
2010-11<br />
County State USA Adjusted Maximum<br />
% <strong>of</strong> Total % % % % % Score Score Score<br />
African-American 10.00 13.70 9.82 6.52 5.92 13.70 10.00 10<br />
Hispanic-American 11.00 13.70 6.22 9.93 4.29 12.45 10.00 10<br />
Asian-American 9.00 11.64 8.84 7.41 7.16 12.93 10.00 10<br />
Other (non-Anglo) 1.00 0.68 2.27 2.54 1.47 6.80 6.80 10 Avg. Score<br />
Classification (score weight%)<br />
Administrators (35%)<br />
Bachelor Degrees or<br />
higher by ethnic group<br />
Weighted Avg. Score<br />
4.14 Faculty 9.20<br />
Ethnic Group<br />
Target for<br />
2010-11<br />
Performance for<br />
2010-11<br />
County State USA Adjusted Maximum<br />
% <strong>of</strong> Total % % % % % Score Score Score<br />
African-American 13.00 17.05 11.92 7.03 6.37 13.12 10.00 10<br />
Hispanic-American 11.00 6.82 6.03 10.11 4.29 6.20 6.20 10<br />
Asian-American 7.00 4.55 7.00 5.64 6.58 6.50 6.50 10<br />
Other (non-Anglo) 0.05 4.55 2.34 2.92 1.66 0.00 10.00 10 Avg. Score<br />
Classification (score weight%)<br />
PSS (20%)<br />
HS Diplomas or GED,<br />
Some <strong>College</strong> but no<br />
degree, Associates<br />
Weighted Avg. Score<br />
2.86 Admin. 8.18<br />
Ethnic Group<br />
Target for<br />
2010-11<br />
Performance for<br />
2010-11<br />
County Adjusted Maximum<br />
% to Total % % Score Score Score<br />
African-American 22.00 23.23 23.11 10.56 10.00 10<br />
Hispanic-American 10.00 13.55 14.31 13.55 10.00 10<br />
Asian-American 6.00 7.10 2.77 11.83 10.00 10<br />
Other (non-Anglo) 1.00 0.97 7.00 9.70 9.70 10 Avg. Score<br />
Weighted Avg. Score<br />
1.99 PSS 9.93<br />
Table 3.4.2B<br />
Source: DCCCD Colleague System<br />
*Strategic measures are those identified for special emphasis by college leadership, the DCCCD Board <strong>of</strong> Trustees, the state or national government, or<br />
SACS accreditation agency. Operational measures are those key to the ongoing vitality <strong>of</strong> the organization but without strategic emphasis.<br />
<strong>End</strong> <strong>of</strong> <strong>Year</strong> <strong>Report</strong> 2010-11