End of Year Report - Richland College
End of Year Report - Richland College
End of Year Report - Richland College

Create successful ePaper yourself
Turn your PDF publications into a flip-book with our unique Google optimized e-Paper software.
<strong>Richland</strong> <strong>College</strong> 105<br />
3.4.2 % <strong>of</strong> employee diversity for full-time employees<br />
Strategic Measure*<br />
Target Range<br />
Performance<br />
% <strong>of</strong> max. target range<br />
≥ 88.20 – 98.00<br />
= 89.86<br />
= 91.70%<br />
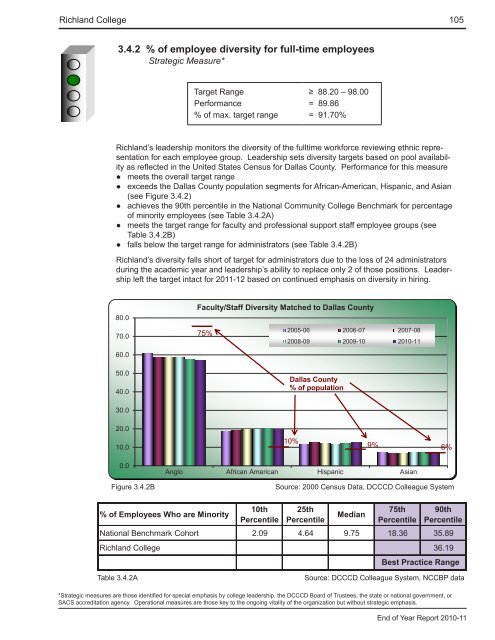
<strong>Richland</strong>’s leadership monitors the diversity <strong>of</strong> the fulltime workforce reviewing ethnic representation<br />
for each employee group. Leadership sets diversity targets based on pool availability<br />
as reflected in the United States Census for Dallas County. Performance for this measure<br />
●●<br />
meets the overall target range<br />
●●<br />
exceeds the Dallas County population segments for African-American, Hispanic, and Asian<br />
●●<br />
●●<br />
●●<br />
(see Figure 3.4.2)<br />
achieves the 90th percentile in the National Community <strong>College</strong> Benchmark for percentage<br />
<strong>of</strong> minority employees (see Table 3.4.2A)<br />
meets the target range for faculty and pr<strong>of</strong>essional support staff employee groups (see<br />
Table 3.4.2B)<br />
falls below the target range for administrators (see Table 3.4.2B)<br />
<strong>Richland</strong>’s diversity falls short <strong>of</strong> target for administrators due to the loss <strong>of</strong> 24 administrators<br />
during the academic year and leadership’s ability to replace only 2 <strong>of</strong> those positions. Leadership<br />
left the target intact for 2011-12 based on continued emphasis on diversity in hiring.<br />
80.0<br />
70.0<br />
Faculty/Staff Diversity Matched to Dallas County<br />
75%<br />
2005-06 2006-07 2007-08<br />
2008-09 2009-10 2010-11<br />
60.0<br />
50.0<br />
40.0<br />
Dallas County<br />
% <strong>of</strong> population<br />
30.0<br />
20.0<br />
10.0<br />
10%<br />
9% 6%<br />
0.0<br />
Figure 3.4.2B<br />
Anglo African American Hispanic Asian<br />
Source: 2000 Census Data, DCCCD Colleague System<br />
% <strong>of</strong> Employees Who are Minority<br />
10th<br />
Percentile<br />
25th<br />
Percentile<br />
Median<br />
75th<br />
Percentile<br />
90th<br />
Percentile<br />
National Benchmark Cohort 2.09 4.64 9.75 18.36 35.89<br />
<strong>Richland</strong> <strong>College</strong> 36.19<br />
Best Practice Range<br />
Table 3.4.2A<br />
Source: DCCCD Colleague System, NCCBP data<br />
*Strategic measures are those identified for special emphasis by college leadership, the DCCCD Board <strong>of</strong> Trustees, the state or national government, or<br />
SACS accreditation agency. Operational measures are those key to the ongoing vitality <strong>of</strong> the organization but without strategic emphasis.<br />
<strong>End</strong> <strong>of</strong> <strong>Year</strong> <strong>Report</strong> 2010-11