End of Year Report - Richland College
End of Year Report - Richland College
End of Year Report - Richland College

Create successful ePaper yourself
Turn your PDF publications into a flip-book with our unique Google optimized e-Paper software.
86<br />
KPI 2.3 Promote student engagement and satisfaction<br />
<strong>Richland</strong> <strong>College</strong><br />
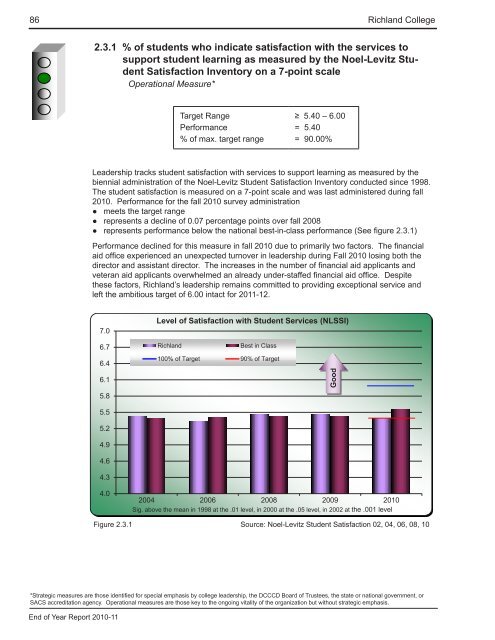
2.3.1 % <strong>of</strong> students who indicate satisfaction with the services to<br />
support student learning as measured by the Noel-Levitz Student<br />
Satisfaction Inventory on a 7-point scale<br />
Operational Measure*<br />
Target Range<br />
Performance<br />
% <strong>of</strong> max. target range<br />
≥ 5.40 – 6.00<br />
= 5.40<br />
= 90.00%<br />
Leadership tracks student satisfaction with services to support learning as measured by the<br />
biennial administration <strong>of</strong> the Noel-Levitz Student Satisfaction Inventory conducted since 1998.<br />
The student satisfaction is measured on a 7-point scale and was last administered during fall<br />
2010. Performance for the fall 2010 survey administration<br />
●●<br />
meets the target range<br />
●●<br />
represents a decline <strong>of</strong> 0.07 percentage points over fall 2008<br />
●●<br />
represents performance below the national best-in-class performance (See figure 2.3.1)<br />
Performance declined for this measure in fall 2010 due to primarily two factors. The financial<br />
aid <strong>of</strong>fice experienced an unexpected turnover in leadership during Fall 2010 losing both the<br />
director and assistant director. The increases in the number <strong>of</strong> financial aid applicants and<br />
veteran aid applicants overwhelmed an already under-staffed financial aid <strong>of</strong>fice. Despite<br />
these factors, <strong>Richland</strong>’s leadership remains committed to providing exceptional service and<br />
left the ambitious target <strong>of</strong> 6.00 intact for 2011-12.<br />
7.0<br />
Level <strong>of</strong> Satisfaction with Student Services (NLSSI)<br />
6.7<br />
6.4<br />
6.1<br />
5.8<br />
5.5<br />
5.2<br />
4.9<br />
4.6<br />
4.3<br />
<strong>Richland</strong><br />
Best in Class<br />
100% <strong>of</strong> Target 90% <strong>of</strong> Target<br />
Good<br />
4.0<br />
Figure 2.3.1<br />
2004 2006 2008 2009 2010<br />
Sig. above the mean in 1998 at the .01 level, in 2000 at the .05 level, in 2002 at the .001 level<br />
Source: Noel-Levitz Student Satisfaction 02, 04, 06, 08, 10<br />
*Strategic measures are those identified for special emphasis by college leadership, the DCCCD Board <strong>of</strong> Trustees, the state or national government, or<br />
SACS accreditation agency. Operational measures are those key to the ongoing vitality <strong>of</strong> the organization but without strategic emphasis.<br />
<strong>End</strong> <strong>of</strong> <strong>Year</strong> <strong>Report</strong> 2010-11