End of Year Report - Richland College
End of Year Report - Richland College
End of Year Report - Richland College

Create successful ePaper yourself
Turn your PDF publications into a flip-book with our unique Google optimized e-Paper software.
80<br />
<strong>Richland</strong> <strong>College</strong><br />
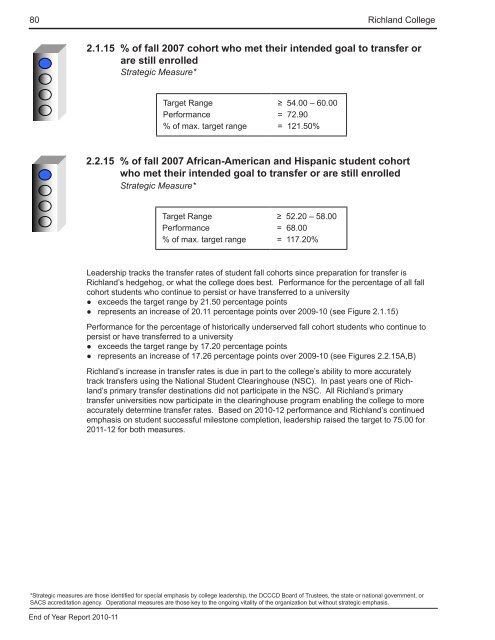
2.1.15 % <strong>of</strong> fall 2007 cohort who met their intended goal to transfer or<br />
are still enrolled<br />
Strategic Measure*<br />
Target Range<br />
Performance<br />
% <strong>of</strong> max. target range<br />
≥ 54.00 – 60.00<br />
= 72.90<br />
= 121.50%<br />
2.2.15 % <strong>of</strong> fall 2007 African-American and Hispanic student cohort<br />
who met their intended goal to transfer or are still enrolled<br />
Strategic Measure*<br />
Target Range<br />
Performance<br />
% <strong>of</strong> max. target range<br />
≥ 52.20 – 58.00<br />
= 68.00<br />
= 117.20%<br />
Leadership tracks the transfer rates <strong>of</strong> student fall cohorts since preparation for transfer is<br />
<strong>Richland</strong>’s hedgehog, or what the college does best. Performance for the percentage <strong>of</strong> all fall<br />
cohort students who continue to persist or have transferred to a university<br />
●●<br />
exceeds the target range by 21.50 percentage points<br />
●●<br />
represents an increase <strong>of</strong> 20.11 percentage points over 2009-10 (see Figure 2.1.15)<br />
Performance for the percentage <strong>of</strong> historically underserved fall cohort students who continue to<br />
persist or have transferred to a university<br />
●●<br />
exceeds the target range by 17.20 percentage points<br />
●●<br />
represents an increase <strong>of</strong> 17.26 percentage points over 2009-10 (see Figures 2.2.15A,B)<br />
<strong>Richland</strong>’s increase in transfer rates is due in part to the college’s ability to more accurately<br />
track transfers using the National Student Clearinghouse (NSC). In past years one <strong>of</strong> <strong>Richland</strong>’s<br />
primary transfer destinations did not participate in the NSC. All <strong>Richland</strong>’s primary<br />
transfer universities now participate in the clearinghouse program enabling the college to more<br />
accurately determine transfer rates. Based on 2010-12 performance and <strong>Richland</strong>’s continued<br />
emphasis on student successful milestone completion, leadership raised the target to 75.00 for<br />
2011-12 for both measures.<br />
*Strategic measures are those identified for special emphasis by college leadership, the DCCCD Board <strong>of</strong> Trustees, the state or national government, or<br />
SACS accreditation agency. Operational measures are those key to the ongoing vitality <strong>of</strong> the organization but without strategic emphasis.<br />
<strong>End</strong> <strong>of</strong> <strong>Year</strong> <strong>Report</strong> 2010-11