- Page 1:
February 2011technical report 2<str
- Page 6 and 7:
thresholds), which represent lowest
- Page 8 and 9:
Table of ContentsE
- Page 10 and 11:
5.5 Summary of the
- Page 12 and 13:
List of TablesTabl
- Page 14 and 15:
Table 4.17Table 4.18Table 4.19Table
- Page 16 and 17:
Table 4.47Table 4.48Table 4.49Table
- Page 18 and 19:
Table 6.4Table 8.1Compounds for Nat
- Page 20 and 21:
Figure 3.17 Map of
- Page 23 and 24:
Figure 5.20 Late Stuart Sockeye Sal
- Page 25 and 26:
List of Acronyms2,
- Page 27 and 28:
AcknowledgementsThe authors would l
- Page 29 and 30:
To assist it in fulfilling this man
- Page 31 and 32:
• Development of
- Page 33 and 34:
Chapter 2 Geographic and Temporal S
- Page 35 and 36:
life history of th
- Page 37 and 38:
• Pitt River Area of</str
- Page 39 and 40:
Chapter 3 Inventory of</str
- Page 41 and 42:
and Paper Mills - Canfor Pulp Limit
- Page 43 and 44:
3.1.1.2 Sawmills, Plywood Mills and
- Page 45 and 46:
(ENKON Environmental Ltd. 2001). Co
- Page 47 and 48:
Effluent toxicity was also included
- Page 49 and 50:
2011 for more information on the lo
- Page 51 and 52:
facilities identified in Table 3.11
- Page 53 and 54:
Inc.), poultry processing facilitie
- Page 55 and 56:
• Polycyclic aromatic hydrocarbon
- Page 57 and 58:
3.1.1.11 Municipal Wastewater Treat
- Page 59 and 60:
• Personal care products (fragran
- Page 61 and 62:
with oxytetracycline, ormetoprim, a
- Page 63 and 64:
In summary, the contaminants that c
- Page 65 and 66:
insecticides, such as phorate, terb
- Page 67 and 68:
3.1.2.4 Runoff fro
- Page 69 and 70:
the substances most amenable to lon
- Page 71 and 72:
• Plastic-related compounds (i.e.
- Page 73 and 74:
were used in the effects and exposu
- Page 75 and 76:
warrants further assessment to dete
- Page 77 and 78:
• Data collected for migration co
- Page 79 and 80:
Hazard quotients were calculated fo
- Page 81 and 82:
Many other substances have the pote
- Page 83 and 84:
Chapter 5 Evaluation of</st
- Page 85 and 86:
For surface water and sediment, the
- Page 87 and 88:
3. For hardness-dependent water qua
- Page 89 and 90:
• 2,3,7,8-TCDD toxic equivalents
- Page 91 and 92:
concern by area of
- Page 93 and 94:
0.05 mg/L; Glew and Hames 1971). As
- Page 95 and 96:
least time rearing in freshwater ha
- Page 97 and 98:
The results of thi
- Page 99 and 100:
Interest and in the South Thompson
- Page 101 and 102:
• Polychlorinated dibenzo-p-dioxi
- Page 103 and 104:
glycoproteins, polypeptides, peptid
- Page 105 and 106:
In-use herbicides in the Fraser Riv
- Page 107 and 108:
and home wood heating; Johannessen
- Page 109 and 110:
Pulp and paper mills, saw mills, an
- Page 111 and 112:
salinity tolerance were significant
- Page 113 and 114:
and gonadosomatic index scores were
- Page 115 and 116:
the lowest observed effect concentr
- Page 117 and 118:
Spitsbergen et al. (1991) reported
- Page 119 and 120:
Chakravorty et al. (1992) observed
- Page 121 and 122:
observed in saltwater gobies (Chasm
- Page 123 and 124:
(See Chapters 4 and 5 for further i
- Page 125 and 126:
emoval efficiency of</stron
- Page 127 and 128:
point and non-point source discharg
- Page 129 and 130:
Location of NatalS
- Page 131 and 132:
Nevertheless, it is possible that e
- Page 133 and 134:
concern relative to human or enviro
- Page 135 and 136:
these substances to aquatic ecosyst
- Page 137 and 138:
• Alkylphenol ethoxylates (APEOs;
- Page 139 and 140:
chemicals of poten
- Page 141 and 142:
productivity data, it is apparent t
- Page 143 and 144:
• Sufficiency - For a cause and e
- Page 145 and 146:
infection by various disease agents
- Page 147 and 148:
magnitude, and spatial extent <stro
- Page 149 and 150:
potential concern were documented a
- Page 151 and 152:
pathways and the intensity and exte
- Page 153 and 154:
Chilko River, Quesnel River, Nechak
- Page 155 and 156:
• The majority of</strong
- Page 157 and 158:
7.4.6 Information on Interactive <s
- Page 159 and 160:
• Development of
- Page 161 and 162:
8.4 Preliminary Evaluation
- Page 163 and 164:
8.5 Evaluation of
- Page 165 and 166:
the low returns of
- Page 167 and 168:
8.9 RecommendationsThis evaluation
- Page 169 and 170:
Chapter 9 References CitedAdams, R.
- Page 171 and 172:
Braune, B., D. Muir, B. DeMarch, M.
- Page 173 and 174:
EIP Associates. 1997. Polychlorinat
- Page 175 and 176:
Gallaugher, P. and L. Wood (Eds). P
- Page 177 and 178:
Hinch, S.G. and E.G. Martins. 2011.
- Page 179 and 180:
Kemble, N.E., D.K. Hardesty, C.G. I
- Page 181 and 182:
MacLatchy, D., L. Peters, J. Nickle
- Page 183 and 184:
Milston, R.H., M.S. Fitzpatrick, A.
- Page 185 and 186:
Peterman, R.M., D. Marmorek, B. Bec
- Page 187 and 188:
Smith, D.B., R.A. Zielinski, H.E. T
- Page 189 and 190:
USACE (U.S. Army Corps of</
- Page 191 and 192:
Walker, M.K., J.M. Spitsbergen, J.R
- Page 193 and 194:
Table 2.1. Overview of</str
- Page 195 and 196:
Table 2.2. Sampling sites for Early
- Page 197 and 198:
Table 2.3. Sampling sites for summe
- Page 199 and 200:
Table 2.4. Sampling sites for river
- Page 201 and 202:
Table 3.1. Listing of</stro
- Page 203 and 204:
Table 3.2. Chemicals of</st
- Page 205 and 206:
Table 3.3. Listing of</stro
- Page 207 and 208:
Table 3.3. Listing of</stro
- Page 209 and 210:
Table 3.3. Listing of</stro
- Page 211 and 212:
Table 3.5. Listing of</stro
- Page 213 and 214:
Table 3.6. Listing of</stro
- Page 215 and 216:
Table 3.7. Listing of</stro
- Page 217 and 218:
Table 3.7. Listing of</stro
- Page 219 and 220:
Table 3.8. Major pipelines transpor
- Page 221 and 222:
Table 3.10. Locations of</s
- Page 223 and 224:
Table 3.11. Listing of</str
- Page 225 and 226:
Table 3.12. Listing of</str
- Page 227 and 228:
Table 3.12. Listing of</str
- Page 229 and 230:
Table 3.12. Listing of</str
- Page 231 and 232:
Table 3.12. Listing of</str
- Page 233 and 234:
Table 3.14. Listing of</str
- Page 235 and 236:
Table 3.14. Listing of</str
- Page 237 and 238:
Table 3.15. Listing of</str
- Page 239 and 240:
Table 3.15. Listing of</str
- Page 241 and 242:
Table 3.16. List of</strong
- Page 243 and 244:
Table 3.17. List of</strong
- Page 245 and 246:
Table 3.18. Location of</st
- Page 247 and 248:
Table 3.18. Location of</st
- Page 249 and 250:
Table 3.18. Location of</st
- Page 251 and 252:
Table 3.18. Location of</st
- Page 253 and 254:
Table 3.18. Location of</st
- Page 255 and 256:
Table 3.18. Location of</st
- Page 257 and 258:
Table 3.19. Listing of</str
- Page 259 and 260:
Table 3.20. Summary of</str
- Page 261 and 262:
Table 3.20. Summary of</str
- Page 263 and 264:
Table 3.21. Summary of</str
- Page 265 and 266:
Table 3.22. Listing of</str
- Page 267 and 268:
Table 3.23. Estimated annual contam
- Page 269 and 270:
Table 3.24. Listing of</str
- Page 271 and 272: Table 3.26. Summary of</str
- Page 273 and 274: Table 3.27. Listing of</str
- Page 275 and 276: Table 3.28. Inventory of</s
- Page 277 and 278: Table 3.28. Inventory of</s
- Page 279 and 280: Table 3.28. Inventory of</s
- Page 281 and 282: Table 3.28. Inventory of</s
- Page 283 and 284: Table 4.1. Selected toxicity screen
- Page 285 and 286: Table 4.2. Selected toxicity screen
- Page 287 and 288: Table 4.3. Summary of</stro
- Page 289 and 290: Table 4.3. Summary of</stro
- Page 291 and 292: Table 4.4. Summary of</stro
- Page 293 and 294: Table 4.4. Summary of</stro
- Page 295 and 296: Table 4.5. Summary of</stro
- Page 297 and 298: Table 4.6. Summary of</stro
- Page 299 and 300: Table 4.6. Summary of</stro
- Page 301 and 302: Table 4.7. Summary of</stro
- Page 303 and 304: Table 4.8. Summary of</stro
- Page 305 and 306: Table 4.8. Summary of</stro
- Page 307 and 308: Table 4.9. Summary of</stro
- Page 309 and 310: Table 4.10. Summary of</str
- Page 311 and 312: Table 4.10. Summary of</str
- Page 313 and 314: Table 4.10. Summary of</str
- Page 315 and 316: Table 4.11. Summary of</str
- Page 317 and 318: Table 4.11. Summary of</str
- Page 319 and 320: Table 4.12. Summary of</str
- Page 321: Table 4.12. Summary of</str
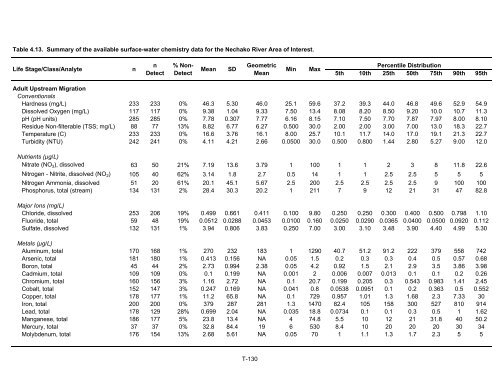
- Page 325 and 326: Table 4.13. Summary of</str
- Page 327 and 328: Table 4.14. Summary of</str
- Page 329 and 330: Table 4.15. Summary of</str
- Page 331 and 332: Table 4.16. Summary of</str
- Page 333 and 334: Table 4.16. Summary of</str
- Page 335 and 336: Table 4.17. Summary of</str
- Page 337 and 338: Table 4.19. Evaluation of</
- Page 339 and 340: Table 4.20. Evaluation of</
- Page 341 and 342: Table 4.21. Evaluation of</
- Page 343 and 344: Table 4.22. Evaluation of</
- Page 345 and 346: Table 4.24. Evaluation of</
- Page 347 and 348: Table 4.25. Evaluation of</
- Page 349 and 350: Table 4.26. Evaluation of</
- Page 351 and 352: Table 4.27. Evaluation of</
- Page 353 and 354: Table 4.28. Evaluation of</
- Page 355 and 356: Table 4.29. Evaluation of</
- Page 357 and 358: Table 4.30. Evaluation of</
- Page 359 and 360: Table 4.31. Evaluation of</
- Page 361 and 362: Table 4.32. Frequency of</s
- Page 363 and 364: Table 4.33. Frequency of</s
- Page 365 and 366: Table 4.35. Frequency of</s
- Page 367 and 368: Table 4.36. Frequency of</s
- Page 369 and 370: Table 4.37. Frequency of</s
- Page 371 and 372: Table 4.38. Frequency of</s
- Page 373 and 374:
Table 4.39. Frequency of</s
- Page 375 and 376:
Table 4.40. Frequency of</s
- Page 377 and 378:
Table 4.41. Frequency of</s
- Page 379 and 380:
Table 4.42. Frequency of</s
- Page 381 and 382:
Table 4.44. Frequency of</s
- Page 383 and 384:
Table 4.45. Summary of</str
- Page 385 and 386:
Table 4.46. Summary of</str
- Page 387 and 388:
Table 4.47. Summary of</str
- Page 389 and 390:
Table 4.47. Summary of</str
- Page 391 and 392:
Table 4.48. Summary of</str
- Page 393 and 394:
Table 4.49. Summary of</str
- Page 395 and 396:
Table 4.50. Summary of</str
- Page 397 and 398:
Table 4.51. Evaluation of</
- Page 399 and 400:
Table 4.52. Frequency of</s
- Page 401 and 402:
Table 4.53. Identification
- Page 403 and 404:
Table 5.1. Selected toxicity refere
- Page 405 and 406:
Table 5.2. Selected toxicity refere
- Page 407 and 408:
Table 5.3. Exposure point concentra
- Page 409 and 410:
Table 5.5. Exposure point concentra
- Page 411 and 412:
Table 5.7. Exposure point concentra
- Page 413 and 414:
Table 5.9. Hazard quotients <strong
- Page 415 and 416:
Table 5.11. Hazard quotients <stron
- Page 417 and 418:
Table 5.13. Frequency of</s
- Page 419 and 420:
Table 5.13. Frequency of</s
- Page 421 and 422:
Table 5.14. Frequency of</s
- Page 423 and 424:
Table 5.15. Frequency of</s
- Page 425 and 426:
Table 5.15. Frequency of</s
- Page 427 and 428:
Table 5.16. Frequency of</s
- Page 429 and 430:
Table 5.17. Frequency of</s
- Page 431 and 432:
Table 5.19. Hazard quotients <stron
- Page 433 and 434:
Table 5.21. Summary of</str
- Page 435 and 436:
Table 5.22. Summary of</str
- Page 437 and 438:
Table 5.23. Mean concentrations <st
- Page 439 and 440:
Table 6.2. Effects
- Page 441 and 442:
Table 6.3. Field studies of
- Page 443 and 444:
Table 6.4. Compounds for National r
- Page 445 and 446:
Table 8.1. Inventory of</st
- Page 447 and 448:
Table 8.1. Inventory of</st
- Page 449 and 450:
Table 8.1. Inventory of</st
- Page 451 and 452:
Table 8.1. Inventory of</st
- Page 453 and 454:
Table 8.1. Inventory of</st
- Page 455 and 456:
Table 8.1. Inventory of</st
- Page 457 and 458:
Table 8.1. Inventory of</st
- Page 459 and 460:
Figures
- Page 461 and 462:
F-2
- Page 463 and 464:
F-4
- Page 465 and 466:
F-6
- Page 467 and 468:
F-8
- Page 469 and 470:
F-10
- Page 471 and 472:
F-12
- Page 473 and 474:
F-14
- Page 475 and 476:
F-16
- Page 477 and 478:
F-18
- Page 479 and 480:
F-20
- Page 481 and 482:
F-22
- Page 483 and 484:
F-24
- Page 485 and 486:
F-26
- Page 487 and 488:
F-28
- Page 489 and 490:
F-30
- Page 491 and 492:
F-32
- Page 493 and 494:
F-34
- Page 495 and 496:
F-36
- Page 497 and 498:
F-38
- Page 499 and 500:
F-40
- Page 501 and 502:
F-42
- Page 503 and 504:
F-44
- Page 505 and 506:
F-46
- Page 507 and 508:
F-48
- Page 509 and 510:
F-50
- Page 511 and 512:
F-52
- Page 513 and 514:
F-54
- Page 515 and 516:
F-56
- Page 517 and 518:
F-58
- Page 519 and 520:
F-60
- Page 521 and 522:
F-62
- Page 523 and 524:
Figure 5.1. Water Quality Index sco
- Page 525 and 526:
Figure 5.3. Fraser River Sockeye Sa
- Page 527 and 528:
Figure 5.5. Pitt Sockeye Salmon Pro
- Page 529 and 530:
Figure 5.7. Weaver Sockeye Salmon P
- Page 531 and 532:
Figure 5.9. Cultus Sockeye Salmon P
- Page 533 and 534:
Figure 5.11. Portage Sockeye Salmon
- Page 535 and 536:
Figure 5.13. Fennell Sockeye Salmon
- Page 537 and 538:
Figure 5.15. Late Shuswap Sockeye S
- Page 539 and 540:
Figure 5.17. Chilko Sockeye Salmon
- Page 541 and 542:
Figure 5.19. Early Stuart Sockeye S
- Page 543 and 544:
Figure 5.21. Stellako Sockeye Salmo
- Page 545 and 546:
Figure 5.23. Bowron Sockeye Salmon
- Page 547 and 548:
Appendices
- Page 549 and 550:
SW4 Deliverables4.1 The Contractor
- Page 551 and 552:
obtained on one species, sometimes
- Page 553 and 554:
• For substances for which the se
- Page 555 and 556:
WeaknessesThere is a lot of
- Page 557 and 558:
Pg 110 Ln 4189 - now called Listene
- Page 559 and 560:
the potential effects of</s
- Page 561 and 562:
A-14
- Page 563 and 564:
4. Fish processing plants are fewer
- Page 565 and 566:
Appendix 3. Environmental Data Sour
- Page 567 and 568:
4. Keyword searches for water quali
- Page 569 and 570:
A3.5 Contaminant Spill ReportsData
- Page 571 and 572:
River Pulp, Kamloops Cellulose Fibr
- Page 573 and 574:
Table A3.1. Water quality stations
- Page 575 and 576:
Table A3.1. Water quality stations
- Page 577 and 578:
Appendix 4. Data Treatment and Meth
- Page 579 and 580:
when multiple samples were reported
- Page 581 and 582:
$ Early rearing of
- Page 583 and 584:
i) The number of t
- Page 585 and 586:
In addition, some sockeye salmon (e
- Page 587 and 588:
• Selecting probable effect conce
- Page 589 and 590:
deBruyn, A.M., H. deBruyn, M.G. Iko
- Page 591 and 592:
Appendix 5. Data description and so
- Page 593 and 594:
Appendix 5. Data description and so
- Page 595 and 596:
Appendix 5. Data description and so
- Page 597 and 598:
Appendix 5. Data description and so
- Page 599 and 600:
Appendix 5. Data description and so
- Page 601 and 602:
Appendix 5. Data description and so
- Page 603:
Appendix 5. Data description and so