Télécharger le texte intégral - ISPED-Enseignement à distance
Télécharger le texte intégral - ISPED-Enseignement à distance
Télécharger le texte intégral - ISPED-Enseignement à distance
- No tags were found...

Create successful ePaper yourself
Turn your PDF publications into a flip-book with our unique Google optimized e-Paper software.
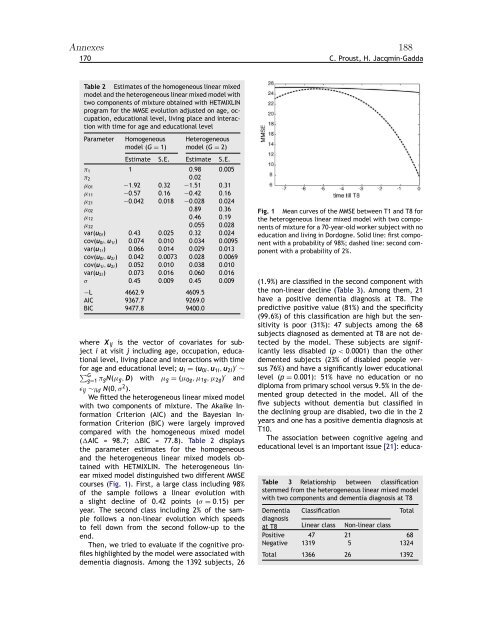
Annexes 188170 C. Proust, H. Jacqmin-GaddaTab<strong>le</strong> 2 Estimates of the homogeneous linear mixedmodel and the heterogeneous linear mixed model withtwo components of mixture obtained with HETMIXLINprogram for the MMSE evolution adjusted on age, occupation,educational <strong>le</strong>vel, living place and interactionwith time for age and educational <strong>le</strong>velParameterHomogeneousmodel (G = 1)Heterogeneousmodel (G = 2)Estimate S.E. Estimate S.E. 1 1 0.98 0.005 2 0.02 01 −1.92 0.32 −1.51 0.31 11 −0.57 0.16 −0.42 0.16 21 −0.042 0.018 −0.028 0.024 02 0.89 0.36 12 0.46 0.19 22 0.055 0.028var(u 0i ) 0.43 0.025 0.32 0.024cov(u 0i , u 1i ) 0.074 0.010 0.034 0.0095var(u 1i ) 0.066 0.014 0.029 0.013cov(u 0i , u 2i ) 0.042 0.0073 0.028 0.0069cov(u 1i , u 2i ) 0.052 0.010 0.038 0.010var(u 2i ) 0.073 0.016 0.060 0.016 0.45 0.009 0.45 0.009−L 4662.9 4609.5AIC 9367.7 9269.0BIC 9477.8 9400.0where X ij is the vector of covariates for subjecti at visit j including age, occupation, educational<strong>le</strong>vel, living place and interactions with timefor age and educational <strong>le</strong>vel; u i = (u 0i , u 1i , u 2i ) ′ ∼∑ Gg=1 g N( g , D) with g = ( 0g , 1g , 2g ) ′ and ij ∼ iid N(0, 2 ).We fitted the heterogeneous linear mixed modelwith two components of mixture. The Akaike InformationCriterion (AIC) and the Bayesian InformationCriterion (BIC) were largely improvedcompared with the homogeneous mixed model(AIC = 98.7; BIC = 77.8). Tab<strong>le</strong> 2 displaysthe parameter estimates for the homogeneousand the heterogeneous linear mixed models obtainedwith HETMIXLIN. The heterogeneous linearmixed model distinguished two different MMSEcourses (Fig. 1). First, a large class including 98%of the samp<strong>le</strong> follows a linear evolution witha slight decline of 0.42 points ( = 0.15) peryear. The second class including 2% of the samp<strong>le</strong>follows a non-linear evolution which speedsto fell down from the second follow-up to theend.Then, we tried to evaluate if the cognitive profi<strong>le</strong>shighlighted by the model were associated withdementia diagnosis. Among the 1392 subjects, 26Fig. 1 Mean curves of the MMSE between T1 and T8 forthe heterogeneous linear mixed model with two componentsof mixture for a 70-year-old worker subject with noeducation and living in Dordogne. Solid line: first componentwith a probability of 98%; dashed line: second componentwith a probability of 2%.(1.9%) are classified in the second component withthe non-linear decline (Tab<strong>le</strong> 3). Among them, 21have a positive dementia diagnosis at T8. Thepredictive positive value (81%) and the specificity(99.6%) of this classification are high but the sensitivityis poor (31%): 47 subjects among the 68subjects diagnosed as demented at T8 are not detectedby the model. These subjects are significantly<strong>le</strong>ss disab<strong>le</strong>d (p