Télécharger le texte intégral - ISPED-Enseignement à distance
Télécharger le texte intégral - ISPED-Enseignement à distance
Télécharger le texte intégral - ISPED-Enseignement à distance
- No tags were found...

You also want an ePaper? Increase the reach of your titles
YUMPU automatically turns print PDFs into web optimized ePapers that Google loves.
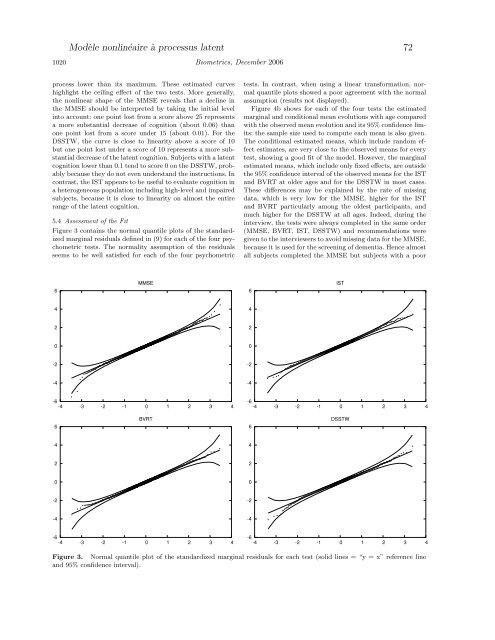
Modè<strong>le</strong> nonlinéaire <strong>à</strong> processus latent 721020 Biometrics, December 2006process lower than its maximum. These estimated curveshighlight the ceiling effect of the two tests. More generally,the nonlinear shape of the MMSE reveals that a decline inthe MMSE should be interpreted by taking the initial <strong>le</strong>velinto account: one point lost from a score above 25 representsa more substantial decrease of cognition (about 0.06) thanone point lost from a score under 15 (about 0.01). For theDSSTW, the curve is close to linearity above a score of 10but one point lost under a score of 10 represents a more substantialdecrease of the latent cognition. Subjects with a latentcognition lower than 0.1 tend to score 0 on the DSSTW, probablybecause they do not even understand the instructions. Incontrast, the IST appears to be useful to evaluate cognition ina heterogeneous population including high-<strong>le</strong>vel and impairedsubjects, because it is close to linearity on almost the entirerange of the latent cognition.5.4 Assessment of the FitFigure 3 contains the normal quanti<strong>le</strong> plots of the standardizedmarginal residuals defined in (9) for each of the four psychometrictests. The normality assumption of the residualsseems to be well satisfied for each of the four psychometrictests. In contrast, when using a linear transformation, normalquanti<strong>le</strong> plots showed a poor agreement with the normalassumption (results not displayed).Figure 4b shows for each of the four tests the estimatedmarginal and conditional mean evolutions with age comparedwith the observed mean evolution and its 95% confidence limits;the samp<strong>le</strong> size used to compute each mean is also given.The conditional estimated means, which include random effectestimates, are very close to the observed means for everytest, showing a good fit of the model. However, the margina<strong>le</strong>stimated means, which include only fixed effects, are outsidethe 95% confidence interval of the observed means for the ISTand BVRT at older ages and for the DSSTW in most cases.These differences may be explained by the rate of missingdata, which is very low for the MMSE, higher for the ISTand BVRT particularly among the oldest participants, andmuch higher for the DSSTW at all ages. Indeed, during theinterview, the tests were always comp<strong>le</strong>ted in the same order(MMSE, BVRT, IST, DSSTW) and recommendations weregiven to the interviewers to avoid missing data for the MMSE,because it is used for the screening of dementia. Hence almostall subjects comp<strong>le</strong>ted the MMSE but subjects with a poor6MMSE6IST442200-2-2-4-4-6-4 -3 -2 -1 0 1 2 3 4-6-4 -3 -2 -1 0 1 2 3 46BVRT6DSSTW442200-2-2-4-4-6-4 -3 -2 -1 0 1 2 3 4-6-4 -3 -2 -1 0 1 2 3 4Figure 3. Normal quanti<strong>le</strong> plot of the standardized marginal residuals for each test (solid lines = “y = x” reference lineand 95% confidence interval).