Télécharger le texte intégral - ISPED-Enseignement à distance
Télécharger le texte intégral - ISPED-Enseignement à distance
Télécharger le texte intégral - ISPED-Enseignement à distance
- No tags were found...

You also want an ePaper? Increase the reach of your titles
YUMPU automatically turns print PDFs into web optimized ePapers that Google loves.
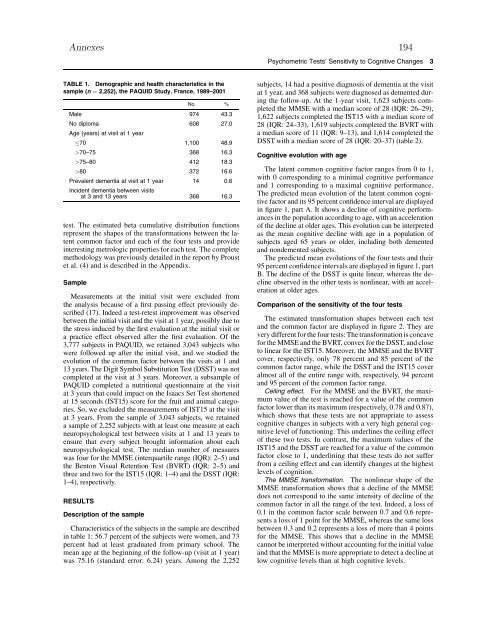
Annexes 194Psychometric Tests’ Sensitivity to Cognitive Changes 3TABLE 1. Demographic and health characteristics in thesamp<strong>le</strong> (n ¼ 2,252), the PAQUID Study, France, 1989–2001No. %Ma<strong>le</strong> 974 43.3No diploma 608 27.0Age (years) at visit at 1 year70 1,100 48.9>70–75 368 16.3>75–80 412 18.3>80 372 16.6Preva<strong>le</strong>nt dementia at visit at 1 year 14 0.6Incident dementia between visitsat 3 and 13 years 368 16.3test. The estimated beta cumulative distribution functionsrepresent the shapes of the transformations between the latentcommon factor and each of the four tests and provideinteresting metrologic properties for each test. The comp<strong>le</strong>temethodology was previously detai<strong>le</strong>d in the report by Proustet al. (4) and is described in the Appendix.Samp<strong>le</strong>Measurements at the initial visit were excluded fromthe analysis because of a first passing effect previously described(17). Indeed a test-retest improvement was observedbetween the initial visit and the visit at 1 year, possibly due tothe stress induced by the first evaluation at the initial visit ora practice effect observed after the first evaluation. Of the3,777 subjects in PAQUID, we retained 3,043 subjects whowere followed up after the initial visit, and we studied theevolution of the common factor between the visits at 1 and13 years. The Digit Symbol Substitution Test (DSST) was notcomp<strong>le</strong>ted at the visit at 3 years. Moreover, a subsamp<strong>le</strong> ofPAQUID comp<strong>le</strong>ted a nutritional questionnaire at the visitat 3 years that could impact on the Isaacs Set Test shortenedat 15 seconds (IST15) score for the fruit and animal categories.So, we excluded the measurements of IST15 at the visitat 3 years. From the samp<strong>le</strong> of 3,043 subjects, we retaineda samp<strong>le</strong> of 2,252 subjects with at <strong>le</strong>ast one measure at eachneuropsychological test between visits at 1 and 13 years toensure that every subject brought information about eachneuropsychological test. The median number of measureswas four for the MMSE (interquarti<strong>le</strong> range (IQR): 2–5) andthe Benton Visual Retention Test (BVRT) (IQR: 2–5) andthree and two for the IST15 (IQR: 1–4) and the DSST (IQR:1–4), respectively.RESULTSDescription of the samp<strong>le</strong>Characteristics of the subjects in the samp<strong>le</strong> are describedin tab<strong>le</strong> 1: 56.7 percent of the subjects were women, and 73percent had at <strong>le</strong>ast graduated from primary school. Themean age at the beginning of the follow-up (visit at 1 year)was 75.16 (standard error: 6.24) years. Among the 2,252subjects, 14 had a positive diagnosis of dementia at the visitat 1 year, and 368 subjects were diagnosed as demented duringthe follow-up. At the 1-year visit, 1,623 subjects comp<strong>le</strong>tedthe MMSE with a median score of 28 (IQR: 26–29),1,622 subjects comp<strong>le</strong>ted the IST15 with a median score of28 (IQR: 24–33), 1,619 subjects comp<strong>le</strong>ted the BVRT witha median score of 11 (IQR: 9–13), and 1,614 comp<strong>le</strong>ted theDSST with a median score of 28 (IQR: 20–37) (tab<strong>le</strong> 2).Cognitive evolution with ageThe latent common cognitive factor ranges from 0 to 1,with 0 corresponding to a minimal cognitive performanceand 1 corresponding to a maximal cognitive performance.The predicted mean evolution of the latent common cognitivefactor and its 95 percent confidence interval are displayedin figure 1, part A. It shows a decline of cognitive performancesin the population according to age, with an acce<strong>le</strong>rationof the decline at older ages. This evolution can be interpretedas the mean cognitive decline with age in a population ofsubjects aged 65 years or older, including both dementedand nondemented subjects.The predicted mean evolutions of the four tests and their95 percent confidence intervals are displayed in figure 1, partB. The decline of the DSST is quite linear, whereas the declineobserved in the other tests is nonlinear, with an acce<strong>le</strong>rationat older ages.Comparison of the sensitivity of the four testsThe estimated transformation shapes between each testand the common factor are displayed in figure 2. They arevery different for the four tests: The transformation is concavefor the MMSE and the BVRT, convex for the DSST, and closeto linear for the IST15. Moreover, the MMSE and the BVRTcover, respectively, only 78 percent and 85 percent of thecommon factor range, whi<strong>le</strong> the DSST and the IST15 coveralmost all of the entire range with, respectively, 94 percentand 95 percent of the common factor range.Ceiling effect. For the MMSE and the BVRT, the maximumvalue of the test is reached for a value of the commonfactor lower than its maximum (respectively, 0.78 and 0.87),which shows that these tests are not appropriate to assesscognitive changes in subjects with a very high general cognitive<strong>le</strong>vel of functioning. This underlines the ceiling effectof these two tests. In contrast, the maximum values of theIST15 and the DSST are reached for a value of the commonfactor close to 1, underlining that these tests do not sufferfrom a ceiling effect and can identify changes at the highest<strong>le</strong>vels of cognition.The MMSE transformation. The nonlinear shape of theMMSE transformation shows that a decline of the MMSEdoes not correspond to the same intensity of decline of thecommon factor in all the range of the test. Indeed, a loss of0.1 in the common factor sca<strong>le</strong> between 0.7 and 0.6 representsa loss of 1 point for the MMSE, whereas the same lossbetween 0.3 and 0.2 represents a loss of more than 4 pointsfor the MMSE. This shows that a decline in the MMSEcannot be interpreted without accounting for the initial valueand that the MMSE is more appropriate to detect a decline atlow cognitive <strong>le</strong>vels than at high cognitive <strong>le</strong>vels.