Walia Special Edition on the Bale Mountains (2011) - Zoologische ...
Walia Special Edition on the Bale Mountains (2011) - Zoologische ...
Walia Special Edition on the Bale Mountains (2011) - Zoologische ...

Create successful ePaper yourself
Turn your PDF publications into a flip-book with our unique Google optimized e-Paper software.
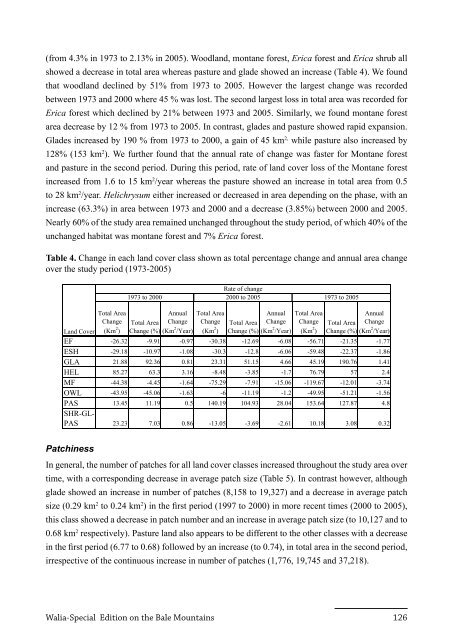
(from 4.3% in 1973 to 2.13% in 2005). Woodland, m<strong>on</strong>tane forest, Erica forest and Erica shrub all<br />
showed a decrease in total area whereas pasture and glade showed an increase (Table 4). We found<br />
that woodland declined by 51% from 1973 to 2005. However <strong>the</strong> largest change was recorded<br />
between 1973 and 2000 where 45 % was lost. The sec<strong>on</strong>d largest loss in total area was recorded for<br />
Erica forest which declined by 21% between 1973 and 2005. Similarly, we found m<strong>on</strong>tane forest<br />
area decrease by 12 % from 1973 to 2005. In c<strong>on</strong>trast, glades and pasture showed rapid expansi<strong>on</strong>.<br />
Glades increased by 190 % from 1973 to 2000, a gain of 45 km2, while pasture also increased by<br />
128% (153 km2 ). We fur<strong>the</strong>r found that <strong>the</strong> annual rate of change was faster for M<strong>on</strong>tane forest<br />
and pasture in <strong>the</strong> sec<strong>on</strong>d period. During this period, rate of land cover loss of <strong>the</strong> M<strong>on</strong>tane forest<br />
increased from 1.6 to 15 km2 /year whereas <strong>the</strong> pasture showed an increase in total area from 0.5<br />
to 28 km2 /year. Helichrysum ei<strong>the</strong>r increased or decreased in area depending <strong>on</strong> <strong>the</strong> phase, with an<br />
increase (63.3%) in area between 1973 and 2000 and a decrease (3.85%) between 2000 and 2005.<br />
Nearly 60% of <strong>the</strong> study area remained unchanged throughout <strong>the</strong> study period, of which 40% of <strong>the</strong><br />
unchanged habitat was m<strong>on</strong>tane forest and 7% Erica forest.<br />
Table 4. Change in each land cover class shown as total percentage change and annual area change<br />
over <strong>the</strong> study period (1973-2005)<br />
Land Cover<br />
Total Area<br />
Change<br />
(Km 2 )<br />
Rate of change<br />
1973 to 2000 2000 to 2005 1973 to 2005<br />
Total Area<br />
Change (%)<br />
Annual<br />
Change<br />
(Km 2 /Year)<br />
Total Area<br />
Change<br />
(Km 2 )<br />
Total Area<br />
Change (%)<br />
Annual<br />
Change<br />
(Km 2 /Year)<br />
Total Area<br />
Change<br />
<str<strong>on</strong>g>Walia</str<strong>on</strong>g>-<str<strong>on</strong>g>Special</str<strong>on</strong>g> <str<strong>on</strong>g>Editi<strong>on</strong></str<strong>on</strong>g> <strong>on</strong> <strong>the</strong> <strong>Bale</strong> <strong>Mountains</strong> 126<br />
(Km 2 )<br />
Total Area<br />
Change (%)<br />
Annual<br />
Change<br />
(Km 2 /Year)<br />
EF -26.32 -9.91 -0.97 -30.38 -12.69 -6.08 -56.71 -21.35 -1.77<br />
ESH -29.18 -10.97 -1.08 -30.3 -12.8 -6.06 -59.48 -22.37 -1.86<br />
GLA 21.88 92.36 0.81 23.31 51.15 4.66 45.19 190.76 1.41<br />
HEL 85.27 63.3 3.16 -8.48 -3.85 -1.7 76.79 57 2.4<br />
MF -44.38 -4.45 -1.64 -75.29 -7.91 -15.06 -119.67 -12.01 -3.74<br />
OWL -43.95 -45.06 -1.63 -6 -11.19 -1.2 -49.95 -51.21 -1.56<br />
PAS 13.45 11.19 0.5 140.19 104.93 28.04 153.64 127.87 4.8<br />
SHR-GL-<br />
PAS 23.23 7.03 0.86 -13.05 -3.69 -2.61 10.18 3.08 0.32<br />
Patchiness<br />
In general, <strong>the</strong> number of patches for all land cover classes increased throughout <strong>the</strong> study area over<br />
time, with a corresp<strong>on</strong>ding decrease in average patch size (Table 5). In c<strong>on</strong>trast however, although<br />
glade showed an increase in number of patches (8,158 to 19,327) and a decrease in average patch<br />
size (0.29 km2 to 0.24 km2 ) in <strong>the</strong> first period (1997 to 2000) in more recent times (2000 to 2005),<br />
this class showed a decrease in patch number and an increase in average patch size (to 10,127 and to<br />
0.68 km2 respectively). Pasture land also appears to be different to <strong>the</strong> o<strong>the</strong>r classes with a decrease<br />
in <strong>the</strong> first period (6.77 to 0.68) followed by an increase (to 0.74), in total area in <strong>the</strong> sec<strong>on</strong>d period,<br />
irrespective of <strong>the</strong> c<strong>on</strong>tinuous increase in number of patches (1,776, 19,745 and 37,218).