- Page 1 and 2:
Walia Spec
- Page 3 and 4:
This Special <stro
- Page 5 and 6:
Foreword The Bale Mountains are uni
- Page 7 and 8:
FACTORS AFFECTING FIRE ExTENT AND F
- Page 9 and 10:
Introduction This Special</
- Page 11 and 12:
Mammals of the Bale Mountains Natio
- Page 13 and 14:
History and Physical Features of th
- Page 15 and 16:
Name of Order Name of Family No of
- Page 17 and 18:
wolf is a rare canid endemic to the
- Page 19 and 20:
Hillman. J. C. 1993. Ethiopia: Comp
- Page 21 and 22:
Scientific name Common name Sources
- Page 23 and 24:
Structuring of the Birds of the Bal
- Page 25 and 26:
interactions? 2) Would such classif
- Page 27 and 28:
feeding habit and the related bill
- Page 29 and 30:
Table 1. Component loadings of fora
- Page 31 and 32:
Assemblage 1 Assemblage 2 Assemblag
- Page 33 and 34:
of a community there must be a prem
- Page 35 and 36:
Hillman, J.C. 1986. The Bale Mounta
- Page 37 and 38:
1995a; Sillero-Zubiri et al. 2004,
- Page 39 and 40:
Monitoring Activities the Bale Moun
- Page 41 and 42:
Table 1. Packs monitored in the Bal
- Page 43 and 44:
long-term study areas. However, tot
- Page 45 and 46:
Creel, S., Spong, G., Sands, J.L.,
- Page 47 and 48:
Observations on the Status of the M
- Page 49 and 50:
The Bale Mountains Figure 1. The kn
- Page 51 and 52:
of the park’s interior, where hum
- Page 53 and 54:
The Ahmar (Chercher) Mountains The
- Page 55 and 56:
Casuarina equisetiflium lia, Hageni
- Page 57 and 58:
Threats Predictably, the main threa
- Page 59 and 60:
populations within hunting blocks a
- Page 61 and 62:
Population Estimates and Diet of St
- Page 63 and 64:
To identify the types and proportio
- Page 65 and 66:
Table 3. Coverage of plant species
- Page 67 and 68:
for eating grass species. During th
- Page 69 and 70:
Ecology and Reproductive Strategy o
- Page 71 and 72:
overall diet (36% of total prey occ
- Page 73 and 74:
Table 1. Ethiopian wolf density (in
- Page 75 and 76:
encounters between neighbouring wol
- Page 77 and 78:
No new packs were formed between 19
- Page 79 and 80:
Cooperative Breeding Role of helper
- Page 81 and 82:
Mean feeding rate (contributions/ho
- Page 83 and 84:
successful dispersal are very low,
- Page 85 and 86:
References Ashenafi, Z.T. 2001. Com
- Page 87 and 88:
Solomon, N. G., and French, J.A. Ed
- Page 89 and 90:
Figure 1. The Bale monkey (Cercopit
- Page 91 and 92:
Survey method - Dec 06-Jan 07 Line
- Page 93 and 94:
Table 3. Estimates of population de
- Page 95 and 96:
Monitoring and management prioritie
- Page 97 and 98:
Amphibians and Reptiles Recorded fr
- Page 99 and 100:
Lizards Agamidae Acanthocercus atri
- Page 101 and 102:
to just two montane sites in Harenn
- Page 103 and 104:
used for comparison. The study reve
- Page 105 and 106:
Mapping High-Altitude Vegetation in
- Page 107 and 108:
of the alpine vegetation have been
- Page 109 and 110:
Observers located each point by GPS
- Page 111 and 112:
Figure 1. Afroalpine vegetation in
- Page 113 and 114:
other, and class N from O, because
- Page 115 and 116:
J. mima mounds and grazed mineral s
- Page 117 and 118:
Node Clusters Species in 1st cluste
- Page 119 and 120:
A. Arboreal heather/lake -E 64.6 +W
- Page 121 and 122:
A. Arboreal heather/lake 82 ± 176
- Page 123 and 124:
elevations of 4100-4200 m a.s.l. in
- Page 125 and 126:
Miehe, G. and Miehe, S. 1994. Erica
- Page 127 and 128:
and managing natural resources and
- Page 129 and 130:
The Bale Mountains National Park is
- Page 131 and 132:
The ground-truthing points made up
- Page 133 and 134:
Table 2. Table showing the area for
- Page 135 and 136:
Table 5. Description of patchiness
- Page 137 and 138:
Acknowledgments This study was fund
- Page 139 and 140:
Characteristics and Origins of Glad
- Page 141 and 142:
Figure 1. Map with the approximate
- Page 143 and 144:
Table 1. Main characteristics of th
- Page 145 and 146:
Table 2. Soil Properties at two dep
- Page 147 and 148: Total aboveground biomass ranged fr
- Page 149 and 150: There might be some evidence for th
- Page 151 and 152: Appendix 1. Attributes for soil pro
- Page 153 and 154: Ogate (altitude 1753 m) Water Site
- Page 155 and 156: the loss of natural forests due to
- Page 157 and 158: Results Fire extent and frequency A
- Page 159 and 160: Soil type Over 50% of the total num
- Page 161 and 162: Distance to settlements The frequen
- Page 163 and 164: than expected given there available
- Page 165 and 166: MOA 2000. Ethiopian Forest Status R
- Page 167 and 168: among seasons are usually only a fe
- Page 169 and 170: In contrast to the northern highlan
- Page 171 and 172: Table 1. The distribution, species
- Page 173 and 174: it was absent from the central subz
- Page 175 and 176: Figure 2. Population structure of t
- Page 177 and 178: Fetene, M., Gashaw, M., Nauke, P. a
- Page 179 and 180: Bale Mountain Lakes: Ecosystems Und
- Page 181 and 182: occurrence above 4000 m. Rainfall i
- Page 183 and 184: Table 1. List of the sampled waterb
- Page 185 and 186: total nitrogen, chlorophyll a, cond
- Page 187 and 188: Eggermont H., Russell, J.M.. Schett
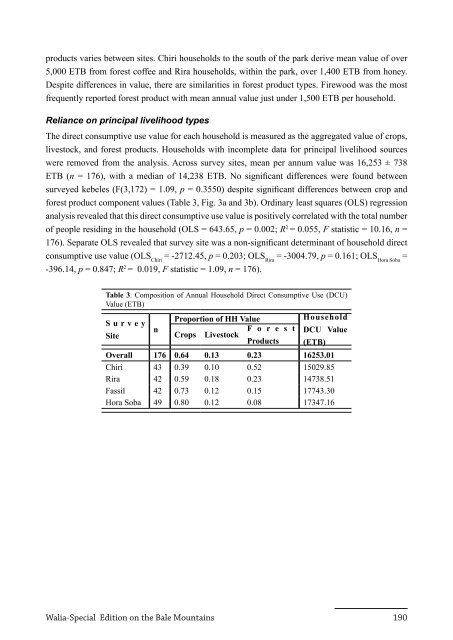
- Page 189 and 190: Direct Consumptive Use Value of Eco
- Page 191 and 192: As more literature seeks to explore
- Page 193 and 194: Table 1. Ecosystem goods and servic
- Page 195 and 196: Figure 1. Map of the Bale Mountains
- Page 197: 2(a) Crop Production HH Crop Value
- Page 201 and 202: accruing to households. Although no
- Page 203 and 204: Acknowledgements This study was mad
- Page 205 and 206: Livestock Grazing in Bale Mountains
- Page 207 and 208: evidence that low levels of grazing
- Page 209 and 210: wildlife, especially the mountain n
- Page 211 and 212: and control sites (areas where live
- Page 213 and 214: several of the Bale ecosystem compo
- Page 215 and 216: Paine, R. T. and Vadas, R. L. 1969.
- Page 217 and 218: their hives. Hive and tree types we
- Page 219 and 220: HOROqqA (Bersama abyssinica, Melian
- Page 221 and 222: Value Chain Analysis for Bamboo Ori
- Page 223 and 224: data recorded by the Development Ag
- Page 225 and 226: Amongst the interviewees, 80% of pe
- Page 227 and 228: Producers As reported previously, b
- Page 229 and 230: The above figure shows the various
- Page 231 and 232: (6) BERSMP and all other stakeholde
- Page 233 and 234: The Distribution, Properties and Us
- Page 235 and 236: preliminary data. From the prelimin
- Page 237 and 238: Figure 1. Map of the southern part
- Page 239 and 240: Addeye All the 11 horas in Addeye a
- Page 241 and 242: Tabalas are used for healing purpos
- Page 243 and 244: Cultural value and history The use
- Page 245 and 246: (Barrett-Lennard 2003). Finally, pr
- Page 247 and 248: Appendix ph Colour Salinity (mS) Ta
- Page 249 and 250:
Villages using the hora Animals vis
- Page 251 and 252:
General Management Planning for the
- Page 253 and 254:
BMNP Management History Since its i
- Page 255 and 256:
effectively and efficiently impleme
- Page 257 and 258:
Problems and Issues A problems and
- Page 259 and 260:
understood threats were also identi
- Page 261 and 262:
Park Operations Programme This prog
- Page 263 and 264:
according to its core vision and pr
- Page 265 and 266:
People in National Parks - Joint Na
- Page 267 and 268:
pastoralists, as part of pastoral s
- Page 269 and 270:
of wild animals (Stephens et al. 20
- Page 271 and 272:
have experience in the implementati
- Page 273 and 274:
2004) or conservation and livelihoo
- Page 275 and 276:
• The redefinition of protected a
- Page 277 and 278:
Risk of Disease Transmission Betwee
- Page 279 and 280:
aspects of these factors, including
- Page 281 and 282:
ecorded as “point vegetation” f
- Page 283 and 284:
Table 1: Composition of 326 ungulat
- Page 285 and 286:
Table 3. Distance from road at whic
- Page 287 and 288:
Transmission risk Clearly, disease
- Page 289 and 290:
Dunn, A.M. 1968. The wild ruminant
- Page 291 and 292:
however continues to rise and in 19
- Page 293 and 294:
Tourism in the Bale Mountains Natio
- Page 295 and 296:
the past 5 years tourism activities
- Page 297 and 298:
assist with implementation of the t
- Page 299 and 300:
An increase in tourism investment i
- Page 301 and 302:
at a loss of approximately ETB 10,0
- Page 303 and 304:
Can Carbon Contribute to Conservati
- Page 305 and 306:
emains. The more recently coined RE
- Page 307 and 308:
Benefits The implementation of such
- Page 309 and 310:
or meet the minimum costs necessary
- Page 311 and 312:
Table 1. Financial forecast for 20
- Page 313 and 314:
across Africa. Biological Conservat
- Page 315 and 316:
sets, extract relevant bits of info
- Page 317 and 318:
What to Monitor? The question of wh
- Page 319 and 320:
scale as a balance where one side r
- Page 321 and 322:
through existing databases not only
- Page 323 and 324:
The moral of these stories are that
- Page 325 and 326:
anger based monitoring system is a
- Page 327 and 328:
spatial and temporal extent of the
- Page 329 and 330:
IUCN Red Listed Species Description
- Page 331 and 332:
Appendix 2: Metadata form A digital
- Page 333 and 334:
and climate data, AVHRR NDVI data,
- Page 335 and 336:
http://www.mentorsoftwareinc.com Me
- Page 337 and 338:
Individual Arrest Form Index No. Lo
- Page 339 and 340:
If for Commercial Market: □ in yo
- Page 341 and 342:
• Improve research work on wildli
- Page 343 and 344:
• Development Partners (donors) a
- Page 345 and 346:
Sustainable Development of the Prot
- Page 347 and 348:
I. Personal details Ethiopian Wildl
- Page 350:
Publication Financially Supported b