Lekwa Local Municipality 2013/14 - Co-operative Governance and ...
Lekwa Local Municipality 2013/14 - Co-operative Governance and ...
Lekwa Local Municipality 2013/14 - Co-operative Governance and ...

Create successful ePaper yourself
Turn your PDF publications into a flip-book with our unique Google optimized e-Paper software.
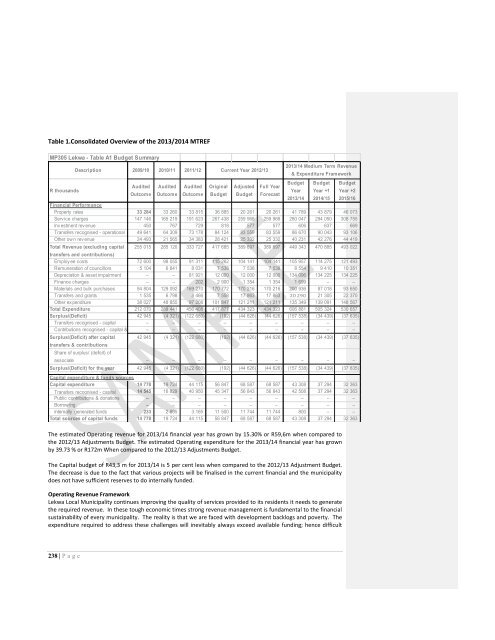
Table 1.<strong>Co</strong>nsolidated Overview of the <strong>2013</strong>/20<strong>14</strong> MTREFMP305 <strong>Lekwa</strong> - Table A1 Budget SummaryDescription 2009/10 2010/11 2011/12R thous<strong>and</strong>sBudget Budget BudgetAudited Audited Audited Original Adjusted Full YearYear Year +1 Year +2Outcome Outcome Outcome Budget Budget Forecast<strong>2013</strong>/<strong>14</strong> 20<strong>14</strong>/15 2015/16Financial PerformanceProperty rates 33 284 33 260 33 815 36 885 20 261 20 261 41 789 43 879 46 073Serv ice charges <strong>14</strong>7 <strong>14</strong>6 165 219 191 623 267 438 259 968 259 968 280 047 294 050 308 755Inv estment rev enue 450 767 729 818 577 577 606 637 669Transfers recognised - operational 49 641 64 309 73 178 84 124 83 559 83 559 86 670 90 043 93 106Other ow n rev enue 24 493 21 565 34 383 28 421 25 332 25 332 40 231 42 276 44 419Total Revenue (excluding capital255 015 285 120 333 727 417 685 389 697 389 697 449 343 470 885 493 022transfers <strong>and</strong> contributions)Employ ee costs 72 600 98 055 91 311 115 262 104 <strong>14</strong>1 104 <strong>14</strong>1 105 957 1<strong>14</strong> 275 121 493Remuneration of councillors 5 104 6 641 8 031 7 538 7 538 7 538 8 554 9 410 10 351Depreciation & asset impairment – – 81 921 12 000 12 000 12 000 134 096 134 225 134 225Finance charges – – 202 2 900 1 354 1 354 1 699 – –Materials <strong>and</strong> bulk purchases 94 804 129 092 169 270 170 772 170 216 170 216 200 936 87 018 93 650Transfers <strong>and</strong> grants 1 535 6 798 8 466 7 558 17 863 17 863 20 290 21 305 22 370Other ex penditure 38 027 48 855 97 208 101 847 121 211 121 211 135 349 139 091 <strong>14</strong>8 567Total Expenditure 212 070 289 441 456 408 417 877 434 323 434 323 606 881 505 324 530 657Surplus/(Deficit) 42 945 (4 321) (122 680) (192) (44 626) (44 626) (157 538) (34 439) (37 635)Transfers recognised - capital – – – – – – – – –<strong>Co</strong>ntributions recognised - capital & contributed – assets – – – – – – – –Surplus/(Deficit) after capitaltransfers & contributionsShare of surplus/ (deficit) ofCurrent Year 2012/13<strong>2013</strong>/<strong>14</strong> Medium Term Revenue& Expenditure Framework42 945 (4 321) (122 680) (192) (44 626) (44 626) (157 538) (34 439) (37 635)associate – – – – – – – – –Surplus/(Deficit) for the year 42 945 (4 321) (122 680) (192) (44 626) (44 626) (157 538) (34 439) (37 635)Capital expenditure & funds sourcesCapital expenditure <strong>14</strong> 778 19 724 44 115 56 847 68 587 68 587 43 308 37 294 32 363Transfers recognised - capital <strong>14</strong> 545 16 829 40 950 45 347 56 843 56 843 42 508 37 294 32 363Public contributions & donations – – – – – – – – –Borrow ing – – – – – – – – –Internally generated funds 233 2 895 3 165 11 500 11 744 11 744 800 – –Total sources of capital funds <strong>14</strong> 778 19 724 44 115 56 847 68 587 68 587 43 308 37 294 32 363The estimated Operating revenue for <strong>2013</strong>/<strong>14</strong> financial year has grown by 15.30% or R59,6m when compared tothe 2012/13 Adjustments Budget. The estimated Operating expenditure for the <strong>2013</strong>/<strong>14</strong> financial year has grownby 39.73 % or R172m When compared to the 2012/13 Adjustments Budget.The Capital budget of R43,3 m for <strong>2013</strong>/<strong>14</strong> is 5 per cent less when compared to the 2012/13 Adjustment Budget.The decrease is due to the fact that various projects will be finalised in the current financial <strong>and</strong> the municipalitydoes not have sufficient reserves to do internally funded.Operating Revenue Framework<strong>Lekwa</strong> <strong>Local</strong> <strong>Municipality</strong> continues improving the quality of services provided to its residents it needs to generatethe required revenue. In these tough economic times strong revenue management is fundamental to the financialsustainability of every municipality. The reality is that we are faced with development backlogs <strong>and</strong> poverty. Theexpenditure required to address these challenges will inevitably always exceed available funding; hence difficult238 | P a g e