Lekwa Local Municipality 2013/14 - Co-operative Governance and ...
Lekwa Local Municipality 2013/14 - Co-operative Governance and ...
Lekwa Local Municipality 2013/14 - Co-operative Governance and ...

You also want an ePaper? Increase the reach of your titles
YUMPU automatically turns print PDFs into web optimized ePapers that Google loves.
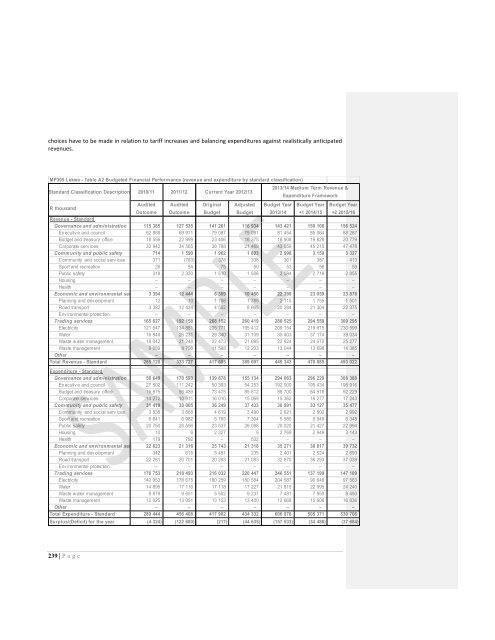
choices have to be made in relation to tariff increases <strong>and</strong> balancing expenditures against realistically anticipatedrevenues.MP305 <strong>Lekwa</strong> - Table A2 Budgeted Financial Performance (revenue <strong>and</strong> expenditure by st<strong>and</strong>ard classification)St<strong>and</strong>ard Classification Description 2010/11 2011/12Current Year 2012/13<strong>2013</strong>/<strong>14</strong> Medium Term Revenue &Expenditure FrameworkR thous<strong>and</strong>Audited Audited Original Adjusted Budget Year Budget Year Budget YearOutcome Outcome Budget Budget <strong>2013</strong>/<strong>14</strong> +1 20<strong>14</strong>/15 +2 2015/16Revenue - St<strong>and</strong>ard<strong>Governance</strong> <strong>and</strong> administration 115 385 127 535 <strong>14</strong>1 261 116 934 <strong>14</strong>3 421 150 108 156 524Ex ecutiv e <strong>and</strong> council 62 888 69 971 79 087 79 091 81 454 85 064 88 267Budget <strong>and</strong> treasury office 18 556 22 999 23 406 16 375 18 908 19 829 20 779<strong>Co</strong>rporate serv ices 33 942 34 565 38 768 21 469 43 059 45 215 47 478<strong>Co</strong>mmunity <strong>and</strong> public safety 7<strong>14</strong> 1 590 1 962 1 893 2 998 3 159 3 327<strong>Co</strong>mmunity <strong>and</strong> social serv ices 371 (783) 378 338 361 387 413Sport <strong>and</strong> recreation 26 54 75 50 53 56 59Public safety 318 2 320 1 510 1 506 2 584 2 716 2 855Housing – – – – – – –Health – – – – – – –Economic <strong>and</strong> environmental services 3 394 12 444 6 309 10 450 22 399 23 059 23 876Planning <strong>and</strong> dev elopment 12 10 1 758 1 785 2 115 1 755 1 501Road transport 3 382 12 434 4 552 8 665 20 284 21 304 22 375Env ironmental protection – – – – – – –Trading services 165 627 192 158 268 152 260 419 280 525 294 559 309 295Electricity 121 647 134 881 205 771 195 412 209 154 219 615 230 599Water 16 848 26 231 28 340 31 109 35 403 37 174 39 034Waste w ater management 18 042 21 248 22 473 21 695 22 924 24 072 25 277Waste management 9 089 9 798 11 568 12 203 13 044 13 698 <strong>14</strong> 385Other – – – – – – –Total Revenue - St<strong>and</strong>ard 285 120 333 727 417 685 389 697 449 343 470 885 493 022Expenditure - St<strong>and</strong>ard<strong>Governance</strong> <strong>and</strong> administration 58 649 178 593 139 878 155 134 294 063 296 229 308 388Ex ecutiv e <strong>and</strong> council 27 502 111 242 50 393 54 253 192 000 195 434 198 916Budget <strong>and</strong> treasury office 16 875 56 439 73 475 85 812 86 700 84 518 92 229<strong>Co</strong>rporate serv ices <strong>14</strong> 272 10 911 16 010 15 069 15 362 16 277 17 243<strong>Co</strong>mmunity <strong>and</strong> public safety 31 419 38 005 36 249 37 433 30 991 33 127 35 477<strong>Co</strong>mmunity <strong>and</strong> social serv ices 3 838 3 668 4 619 3 490 2 621 2 802 2 992Sport <strong>and</strong> recreation 6 641 6 982 5 765 7 304 5 580 5 949 6 348Public safety 20 750 26 556 23 537 26 098 20 020 21 427 22 994Housing 10 6 2 327 9 2 769 2 949 3 <strong>14</strong>3Health 179 792 – 532 – – –Economic <strong>and</strong> environmental services 22 623 21 316 25 743 21 318 35 271 38 817 39 732Planning <strong>and</strong> dev elopment 342 615 5 451 235 2 401 2 524 2 693Road transport 22 281 20 701 20 293 21 083 32 870 36 293 37 039Env ironmental protection – – – – – – –Trading services 176 753 218 493 216 032 220 447 246 551 137 199 <strong>14</strong>7 109Electricity <strong>14</strong>0 953 178 675 180 259 180 584 204 587 90 648 97 583Water <strong>14</strong> 895 17 116 17 118 17 227 21 815 22 995 24 240Waste w ater management 8 879 9 651 5 502 9 237 7 481 7 950 8 450Waste management 12 025 13 051 13 153 13 400 12 668 15 606 16 836Other – – – – – – –Total Expenditure - St<strong>and</strong>ard 289 444 456 408 417 902 434 332 606 876 505 371 530 706Surplus/(Deficit) for the year (4 324) (122 680) (217) (44 635) (157 533) (34 486) (37 684)239 | P a g e