Lekwa Local Municipality 2013/14 - Co-operative Governance and ...
Lekwa Local Municipality 2013/14 - Co-operative Governance and ...
Lekwa Local Municipality 2013/14 - Co-operative Governance and ...

You also want an ePaper? Increase the reach of your titles
YUMPU automatically turns print PDFs into web optimized ePapers that Google loves.
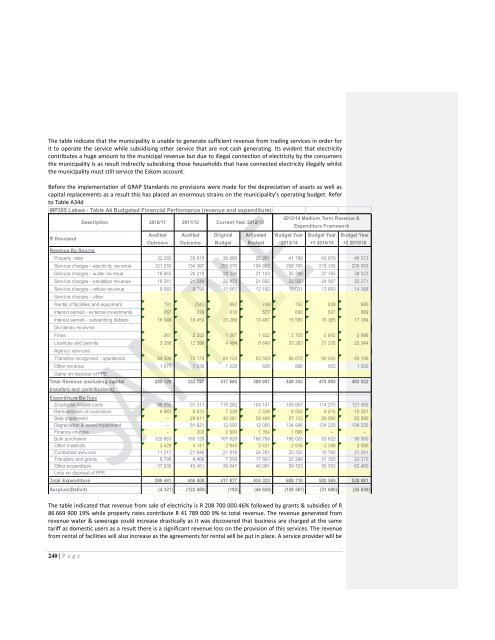
The table indicate that the municipality is unable to generate sufficient revenue from trading services in order forit to operate the service while subsidising other service that are not cash generating. Its evident that electricitycontributes a huge amount to the municipal revenue but due to illegal connection of electricity by the consumersthe municipality is as result indirectly subsidising those households that have connected electricity illegally whilstthe municipality must still service the Eskom account.Before the implementation of GRAP St<strong>and</strong>ards no provisions were made for the depreciation of assets as well ascapital replacements as a result this has placed an enormous strains on the municipality’s operating budget. Referto Table A34dMP305 <strong>Lekwa</strong> - Table A4 Budgeted Financial Performance (revenue <strong>and</strong> expenditure)R thous<strong>and</strong>Revenue By SourceDescription 2010/11 2011/12AuditedOutcomeAuditedOutcomeOriginalBudgetAdjustedBudgetBudget Year<strong>2013</strong>/<strong>14</strong>Budget Year+1 20<strong>14</strong>/15Budget Year+2 2015/16Property rates 33 260 33 815 36 885 20 261 41 789 43 879 46 073Serv ice charges - electricity rev enue 121 250 134 367 205 070 194 982 208 700 219 135 230 093Serv ice charges - w ater rev enue 16 845 26 218 28 335 31 103 35 396 37 165 39 023Serv ice charges - sanitation rev enue 18 041 21 248 22 473 21 692 22 920 24 067 25 271Serv ice charges - refuse rev enue 9 083 9 790 11 561 12 192 13 031 13 683 <strong>14</strong> 368Serv ice charges - otherRental of facilities <strong>and</strong> equipment 791 (345) 862 749 792 838 885Interest earned - ex ternal inv estments 767 729 818 577 606 637 669Interest earned - outst<strong>and</strong>ing debtors 16 048 18 450 20 269 13 487 15 585 16 365 17 184Div idends receiv edFines 361 2 352 1 567 1 622 2 705 2 842 2 986Licences <strong>and</strong> permits 3 288 12 396 4 494 8 649 20 263 21 278 22 344Agency serv icesTransfers recognised - operational 64 309 73 178 84 124 83 559 86 670 90 043 93 106Other rev enue 1 077 1 530 1 229 826 886 953 1 020Gains on disposal of PPETotal Revenue (excluding capitaltransfers <strong>and</strong> contributions)Current Year 2012/13<strong>2013</strong>/<strong>14</strong> Medium Term Revenue &Expenditure Framework285 120 333 727 417 685 389 697 449 343 470 885 493 022Expenditure By TypeEmploy ee related costs 98 055 91 311 115 262 104 <strong>14</strong>1 105 957 1<strong>14</strong> 275 121 493Remuneration of councillors 6 641 8 031 7 538 7 538 8 554 9 410 10 351Debt impairment – 29 911 40 081 55 469 57 133 59 990 62 990Depreciation & asset impairment – 81 921 12 000 12 000 134 096 134 225 134 225Finance charges – 202 2 900 1 354 1 699 – –Bulk purchases 125 663 165 129 167 828 166 784 198 020 83 622 90 060Other materials 3 429 4 <strong>14</strong>1 2 945 3 431 2 916 3 396 3 590<strong>Co</strong>ntracted serv ices 11 217 21 846 21 818 24 761 20 322 16 790 21 341Transfers <strong>and</strong> grants 6 798 8 466 7 558 17 863 20 290 21 305 22 370Other ex penditure 37 638 45 451 39 947 40 981 59 723 59 552 62 460Loss on disposal of PPETotal Expenditure 289 441 456 408 417 877 434 323 608 710 502 565 528 881Surplus/(Deficit) (4 321) (122 680) (192) (44 626) (159 367) (31 680) (35 859)The table indicated that revenue from sale of electricity is R 208 700 000.46% followed by grants & subsidies of R86 669 900 19% while property rates contribute R 41 789 000 9% to total revenue. The revenue generated fromrevenue water & sewerage could increase drastically as it was discovered that business are charged at the sametariff as domestic users as a result there is a significant revenue loss on the provision of this services. The revenuefrom rental of facilities will also increase as the agreements for rental will be put in place. A service provider will be240 | P a g e