Lekwa Local Municipality 2013/14 - Co-operative Governance and ...
Lekwa Local Municipality 2013/14 - Co-operative Governance and ...
Lekwa Local Municipality 2013/14 - Co-operative Governance and ...

You also want an ePaper? Increase the reach of your titles
YUMPU automatically turns print PDFs into web optimized ePapers that Google loves.
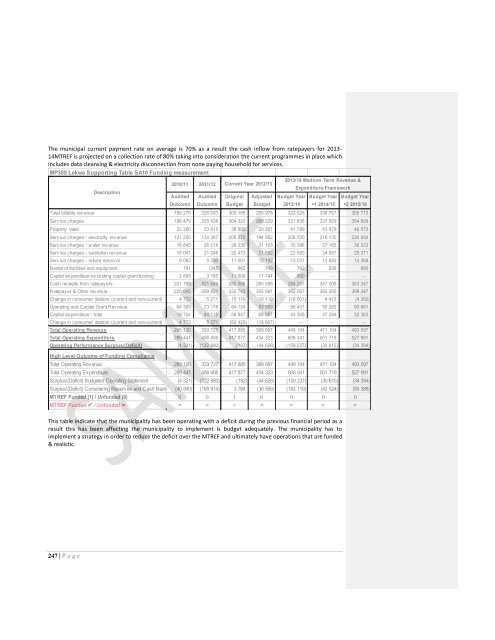
The municipal current payment rate on average is 70% as a result the cash inflow from ratepayers for <strong>2013</strong>-<strong>14</strong>MTREF is projected on a collection rate of 80% taking into consideration the current programmes in place whichincludes data cleansing & electricity disconnection from none paying household for services.MP305 <strong>Lekwa</strong> Supporting Table SA10 Funding measurement<strong>2013</strong>/<strong>14</strong> Medium Term Revenue &2010/11 2011/12 Current Year 2012/13Expenditure FrameworkDescriptionAudited Audited Original Adjusted Budget Year Budget Year Budget YearOutcomeOutcomeBudgetBudget<strong>2013</strong>/<strong>14</strong>+1 20<strong>14</strong>/15+2 2015/16Total billable rev enue 199 270 225 093 305 185 280 978 322 628 338 767 355 713Serv ice charges 198 479 225 438 304 323 280 229 321 836 337 929 354 828Property rates 33 260 33 815 36 885 20 261 41 789 43 879 46 073Serv ice charges - electricity rev enue 121 250 134 367 205 070 194 982 208 700 219 135 230 093Serv ice charges - w ater rev enue 16 845 26 218 28 335 31 103 35 396 37 165 39 023Serv ice charges - sanitation rev enue 18 041 21 248 22 473 21 692 22 920 24 067 25 271Serv ice charges - refuse remov al 9 083 9 790 11 561 12 192 13 031 13 683 <strong>14</strong> 368Rental of facilities <strong>and</strong> equipment 791 (345) 862 749 792 838 885Capital ex penditure ex cluding capital grant funding 2 895 3 165 11 500 11 744 800 – –Cash receipts from ratepay ers 221 789 321 649 280 586 280 586 284 207 347 006 363 247Ratepay er & Other rev enue 220 045 259 821 332 743 305 561 362 067 380 205 399 247Change in consumer debtors (current <strong>and</strong> non-current) 4 772 5 271 10 119 10 119 (18 607) 6 472 (4 392)Operating <strong>and</strong> Capital Grant Rev enue 64 309 73 178 84 124 83 559 86 431 90 262 93 681Capital ex penditure - total 19 724 44 115 56 847 68 587 43 308 37 294 32 363Change in consumer debtors (current <strong>and</strong> non-current) 4 772 5 271 (50 429) (18 607) – – –Total Operating Revenue 285 120 333 727 417 685 389 697 449 104 471 104 493 597Total Operating Expenditure 289 441 456 408 417 877 434 323 608 341 501 719 527 991Operating Performance Surplus/(Deficit) (4 321) (122 680) (192) (44 626) (159 237) (30 615) (34 394)High Level Outcome of Funding <strong>Co</strong>mplianceTotal Operating Revenue 285 120 333 727 417 685 389 697 449 104 471 104 493 597Total Operating Expenditure 289 441 456 408 417 877 434 323 608 341 501 719 527 991Surplus/(Deficit) Budgeted Operating Statement (4 321) (122 680) (192) (44 626) (159 237) (30 615) (34 394)Surplus/(Deficit) <strong>Co</strong>nsidering Reserves <strong>and</strong> Cash Backing (40 840) (165 9<strong>14</strong>) 3 784 (36 566) (182 119) (42 524) (50 388)MTREF Funded (1) / Unfunded (0) 0 0 1 0 0 0 0MTREF Funded / Unfunded This table indicate that the municipality has been operating with a deficit during the previous financial period as aresult this has been affecting the municipality to implement is budget adequately. The municipality has toimplement a strategy in order to reduce the deficit over the MTREF <strong>and</strong> ultimately have operations that are funded& realistic.247 | P a g e