- Page 2 and 3:
! ! ! ! ! ! ! ! ! ! ! ! ! ! ! ! ! !
- Page 4 and 5:
In ricordo del collega Nicolas Ganz
- Page 6 and 7:
linguaggio comune indispensabile pe
- Page 8 and 9:
Il progetto MOMAR si propone di dar
- Page 10 and 11:
Fig. 1.3.2 - Attività multidiscipl
- Page 12 and 13:
Il modello di governance nella rete
- Page 14 and 15:
12 Pagina 3 di 3 di 36 36 Naturalme
- Page 16 and 17:
Definizione degli obiettivi Azioni
- Page 18 and 19:
16 Pagina 7 di 36 Ciò con specific
- Page 20 and 21:
18 Pagina 9 di 36 Gli esempi del pr
- Page 22 and 23:
ESEMPIO ESEMPIO 2 2 FONTE FONTE DIR
- Page 24 and 25:
Indicatori estrinseci Figura 2.2.1.
- Page 26 and 27:
24 Pagina Pagina 15 di 15 Pagina 36
- Page 28 and 29:
Num. Causa Stato coinvolto C-33/05
- Page 30 and 31:
28 Pagina 19 di 36 legami politici
- Page 32 and 33:
30 Pagina 21 di 36 Fonte internazio
- Page 34 and 35:
32 Pagina 23 di 36 b) l’attuazion
- Page 36 and 37:
34 Pagina 25 di 36 stessi principi
- Page 38 and 39:
36 Pagina 27 di 36 internazionali o
- Page 40 and 41:
38 Pagina 29 di 36 Convenzione dell
- Page 42 and 43:
40 Pagina 31 di 36 Se l’acquisizi
- Page 44 and 45:
42 Pagina Pagina 33 di 33 36 di 36
- Page 46 and 47:
44 Pagina 35 di 36 un sistema di in
- Page 48 and 49:
La governance multilivello nell’e
- Page 50 and 51:
dettagliata gli effetti negativi ch
- Page 52 and 53:
pubblico sul valore dell’economia
- Page 54 and 55:
obiettivi contribuiscono alla reali
- Page 56 and 57:
entro il 2016, avvio del programma
- Page 58 and 59:
il suo sviluppo sia sostenibile. A
- Page 60 and 61:
4. Buone pratiche: principali proge
- Page 62 and 63:
l’Ambiente, Eurostat, DG Mare, DG
- Page 64 and 65:
grado di valutare le caratteristich
- Page 66 and 67:
CASO STUDIO: IL RUOLO DELLE REGIONI
- Page 68 and 69:
inserite anche nel programma Marco
- Page 70 and 71:
LA SFERA PUBBLICA Gli attori pubbli
- Page 72 and 73:
canale per creare sempre maggiori c
- Page 74 and 75:
L’INFLUENZA DELLE REGIONI SULLE P
- Page 76 and 77:
enefici che ne deriveranno anche in
- Page 78 and 79:
Fig. 3.1.1 - Santuario dei Mammifer
- Page 80 and 81:
- il Parco Regionale della Maremma,
- Page 82 and 83:
Le aree marine protette in Italia s
- Page 84 and 85:
dell'inquinamento marino all'intern
- Page 86 and 87:
• cavi e condotti sottomarini (pe
- Page 88 and 89:
Le risposte della società atte a p
- Page 90 and 91:
globicefalo, di grampo, di tursiope
- Page 92 and 93:
COMPONENTI IMPATTATE MODALITA' D'IM
- Page 94 and 95:
COMPONENTI IMPATTATE MODALITA' D'IM
- Page 96 and 97:
3.4- L’utilizzo del metodo DPSIR
- Page 98 and 99:
DENPMINAZIONE Caratterizzazione del
- Page 100 and 101:
Tab. 3.4.2 - Rete di monitoraggio s
- Page 102 and 103:
La Regione Toscana controlla la qua
- Page 104 and 105:
INDICE 4. Sperimentazione di un mon
- Page 106 and 107:
4.5 Bibliografia 4) SPERIMENTAZIONE
- Page 108 and 109:
per programmi di monitoraggio final
- Page 110 and 111:
1- Stazione esterna al Porto di Liv
- Page 112 and 113:
Biomarker indagati Per questa ricer
- Page 114 and 115:
l’analisi dell’immagine dedicat
- Page 116 and 117:
all’esterno del Porto di Livorno
- Page 118 and 119:
elevata biodisponibilità di rame n
- Page 120 and 121:
Per quanto riguarda i biomarker bas
- Page 122 and 123:
interazioni tra blastomeri e tessut
- Page 124 and 125:
Rapporto sperma/uovo Vengono prelev
- Page 126 and 127:
Fig. 1 Fig. - Camera 1 - Camera d
- Page 128 and 129:
stato considerato il tempo nel qual
- Page 130 and 131:
1 6 4 5 Darsena Petroli Livorno Por
- Page 132 and 133:
Prove a diverse temperature I risul
- Page 134 and 135:
Seconda prova In questa prova, tutt
- Page 136 and 137:
Quinta prova In questa ultima, per
- Page 138 and 139:
La Fig. 11 si riferisce al confront
- Page 140 and 141:
• sono stati integrati nel tempo
- Page 142 and 143:
La relazione tra la quantità di me
- Page 144 and 145:
dell’Accademia, ad un tratto di s
- Page 146 and 147:
300,000 250,000 200,000 150,000 100
- Page 148 and 149:
In fig. 4 sono riportate, sempre in
- Page 150 and 151:
Confrontando le concentrazioni dei
- Page 152 and 153:
tossicità in entrambe le stazioni.
- Page 154 and 155:
Hg Ba Cr Cu Mn Ni V Fe Zn As Cd Pb
- Page 156 and 157:
4.1.5 Considerazioni sul monitoragg
- Page 158 and 159:
prescindere dal perfezionamento del
- Page 160 and 161:
attività industriali ed artigianal
- Page 162 and 163:
affrontare lo studio della speciazi
- Page 164 and 165:
procedura di estrazione e al suo im
- Page 166 and 167:
Step I: Frazione scambiabile e lega
- Page 168 and 169:
PIOMBO Step 1 Step 2 Step 3 VALORE
- Page 170 and 171:
Staz. 1, Cogoleto: speciazione di c
- Page 172 and 173:
100% 90% 80% 70% 60% 50% 40% 30% 20
- Page 174 and 175:
Staz. 4, Viareggio: speciazione di
- Page 176 and 177:
100% 80% 60% 40% 20% 0% 100% 80% 60
- Page 178 and 179:
100% 90% 80% 70% 60% 50% 40% 30% 20
- Page 180 and 181:
Staz. 8, davanti alla foce del fium
- Page 182 and 183:
Percentuali di Cr nelle singole fra
- Page 184 and 185:
alle normali condizioni ambientali
- Page 186 and 187:
100% 80% 60% 40% 20% 0% 100% 80% 60
- Page 188 and 189:
100% 100% 80% 60% 40% 20% 80% 60% 4
- Page 190 and 191:
Risultati I risultati relativi alla
- Page 192 and 193:
possibili relazioni tra accumulo e
- Page 194 and 195:
10 9 8 7 6 5 4 3 2 1 0 Arsenico Bio
- Page 196 and 197:
Tab. 1. Parametri chimico-fisici de
- Page 198 and 199:
4.2.3 Saggi ecotossicologici sui su
- Page 200 and 201:
Piombino: PI 5 (porto) e PI 8 (a la
- Page 202 and 203:
Elaborazioni dei dati Il saggio bio
- Page 204 and 205:
Tab. 2. Scala di tossicità relativ
- Page 206 and 207:
Hediste diversicolor Gli organismi
- Page 208 and 209:
Tab. 5. Parametri chimico-fisici de
- Page 210 and 211:
Paracentrotus lividus In tabella 7
- Page 212 and 213:
quantificati degli degli EC20 EC20
- Page 214 and 215:
Tab. 10. Tab. Risultati 10. Risulta
- Page 216 and 217:
AR7 AR7 AR7 0,22 0,22 99,60 99,60 0
- Page 218 and 219:
Fig. 11. Ripartizione granulometric
- Page 220 and 221:
Tab. 13. Risultati della tossicità
- Page 222 and 223:
4.2.4 Valutazione della tossicità
- Page 224 and 225:
Dieci zone (Bastia, Ajaccio, Livorn
- Page 226 and 227:
Tavola 1: Sintesi dei risultati del
- Page 228 and 229:
Tino Tino Rossi, Rossi, e la e la d
- Page 230 and 231:
Figura 7: 7: Tossicità dei dei sed
- Page 232 and 233:
Figura 10 : Tossicità dei sediment
- Page 234 and 235:
A B C Figura 13: Tossicità dei sed
- Page 236 and 237:
- La cartografia della tossicità n
- Page 238 and 239:
Figura 15: Progetto MOMAR: Esempi d
- Page 240 and 241:
media calcolata per il periodo di u
- Page 242 and 243:
ambientali presenta un diametro mol
- Page 244 and 245:
questo modo problemi di matrice leg
- Page 246 and 247:
campionamento istantaneo non può e
- Page 248 and 249:
4.3.7 Materiali e metodi A-Composti
- Page 250 and 251:
Strumentazione: Per la purificazion
- Page 252 and 253:
Determinazione strumentale degli id
- Page 254 and 255:
il metodo proposto da De Stiger et
- Page 256 and 257:
presenti con lo stesso numero di in
- Page 258 and 259:
Isola dell’Asinara. I principali
- Page 260 and 261:
Sedimenti Asinara Figura 7. Metalli
- Page 262 and 263:
2. Arcipelago di La Maddalena I cam
- Page 264 and 265:
Acqua 262
- Page 266 and 267:
Sedimenti 264
- Page 268 and 269:
3-Golfo di Olbia- Isola di Tavolara
- Page 270 and 271:
Sedimenti 268
- Page 272 and 273:
Area costiera sud-occidentale (Port
- Page 274 and 275:
Figura 17. Metalli e idrocarburi po
- Page 276 and 277:
Acqua Figura 19. Campionamento pass
- Page 278 and 279:
6.Golfo di Cagliari I campionamenti
- Page 280 and 281:
Acqua 278
- Page 282 and 283:
Area 2. Pula- Area industriale Sarr
- Page 284 and 285:
Figura 22. Metalli e IPA nei sedime
- Page 286 and 287:
Per quanto riguarda l’area di La
- Page 288 and 289:
3.3.9. Ringraziamenti Nella realizz
- Page 290 and 291:
specialmente se integrato con lo st
- Page 292 and 293:
Barghigiani, C., and De Ranieri, S.
- Page 294 and 295:
Danovaro R. (2000) - Benthic microb
- Page 296 and 297:
Galgani, F., Senia, J. , Guillou, J
- Page 298 and 299:
Losi, M.E., Amrhein, C., and Franke
- Page 300 and 301:
Quiniou, F., His, E., Delesmont, R.
- Page 302 and 303:
Twiss, M.R., and Moffett, J.W. (200
- Page 304 and 305:
Modellistica idrodinamica Carlo Bra
- Page 306 and 307:
talvolta utilizzati nella pratica,
- Page 308 and 309:
atmosferico a sua volta caratterizz
- Page 310 and 311:
Inoltre occorre segnalare che i due
- Page 312 and 313:
icavate da campagne oceanografiche,
- Page 314 and 315:
Figura 2.1 Esempio dei risulati pro
- Page 316 and 317:
piattaforma ad Ovest della Corsica
- Page 318 and 319:
di Boussinesq), e infine che le acc
- Page 320 and 321:
è anche possibile utilizzare i cam
- Page 322 and 323:
2.4 Confronto con i dati misurati 2
- Page 324 and 325:
prolungati nel tempo, e mal riprodo
- Page 326 and 327:
Modèle Corse 400m Modèle MENOR 1.
- Page 328 and 329:
a) La dinamica della zona sud-ovest
- Page 330 and 331:
Figure 3. 1 Batimetria del dominio
- Page 332 and 333:
Figure 3. 2 Campo delle correnti, o
- Page 334 and 335:
Risoluzione verticale 30 coordinate
- Page 336 and 337:
Figura Figura 3.5 3.5 Tipica Tipica
- Page 338 and 339:
un’ampia copertura spaziale e di
- Page 340 and 341:
Figura 4. 1 Immersione in acqua del
- Page 342 and 343:
tragitto, due boe SVP-GPS Argos son
- Page 344 and 345:
misure oceanografiche effettuate ne
- Page 346 and 347:
una componente di velocità superfi
- Page 348 and 349:
3. Un drifter prototipo realizzato
- Page 350 and 351:
Dopo due settimane un solo drifter
- Page 352 and 353:
Figura 4. 13 Posizione dei drifters
- Page 354 and 355:
Figura 4. 16 Profili di temperatura
- Page 356 and 357:
Figura 4. 20 Sezione delle salinit
- Page 358 and 359:
Figura 4. 23 Serie temporali degli
- Page 360 and 361:
Tali mappe permettono sia un confro
- Page 362 and 363:
Figura 4. 28 Scatter plot delle vel
- Page 364 and 365:
Figura 4. 31 Mappe di corrente supe
- Page 366 and 367:
Figura 4. 33 Mappe di corrente supe
- Page 368 and 369:
Figura 4. 36 Mappa di salinità in
- Page 370 and 371:
Figura Figura 4. 38 Mappa 4. 38 Map
- Page 372 and 373:
Figura 4. 41 Confronto tra dati spe
- Page 374 and 375:
5. I modelli a scala limitata: il c
- Page 376 and 377:
- Scomposizione dell’integrazione
- Page 378 and 379:
4) O-N-S-P-Mn-Fe RedOxLayer Model (
- Page 380 and 381:
3. Boundary Condition marine di sup
- Page 382 and 383:
isoluzione intermedia (0.0048°). T
- Page 384 and 385:
Vengono mostrate l’evoluzione del
- Page 386 and 387:
modello di circolazione dell’Asin
- Page 388 and 389:
Figura 5.8 GETM 0.0016°. Istante d
- Page 390 and 391:
Figura 5.13 GETM 0.0016°. Istante
- Page 392 and 393:
ispettivamente sul modello GETM, a
- Page 394 and 395:
Il modello suddivide l'area di stud
- Page 396 and 397: L'attività agricola prevalente è
- Page 398 and 399: Figura 6.4 Sub-bacini e rete idrogr
- Page 400 and 401: Figura 6.5 Uso del suolo ricostruit
- Page 402 and 403: Figura 6.7 Caratteristiche e distri
- Page 404 and 405: - una matrice di sensitività J del
- Page 406 and 407: In Figura 6.10 e Figura 6.11 vengon
- Page 408 and 409: Figura 6.13 Carico dei nitrati sver
- Page 410 and 411: Di seguito sono elencati gli strati
- Page 412 and 413: Figura 6.18 Uso del suolo L’incro
- Page 414 and 415: Il modello è stato fatto girare co
- Page 416 and 417: 6.4.2 Risultati Il ciclo idrologico
- Page 418 and 419: Figura 6.25 Azoto Organico nelgi an
- Page 420 and 421: Fennel (2006), Nitrogen cycling in
- Page 422 and 423: Capitolo 6: MONITORAGGIO SATELLITAR
- Page 424 and 425: particellati e disciolti. In queste
- Page 426 and 427: 6.1 Le opportunità del monitoraggi
- Page 428 and 429: Le osservazioni di ocean color effe
- Page 430 and 431: Il fitoplancton presenta un’alta
- Page 432 and 433: Questo algoritmo ha mostrato ottime
- Page 434 and 435: isultano in queste acque di poca ut
- Page 436 and 437: fluorescenza naturale della clorofi
- Page 438 and 439: Bran Lubbe. Con la sigla DIN, utili
- Page 440 and 441: termoclino che limita quindi il mes
- Page 442 and 443: µM µM µM 2.5 2.0 1.5 1.0 0.5 0.0
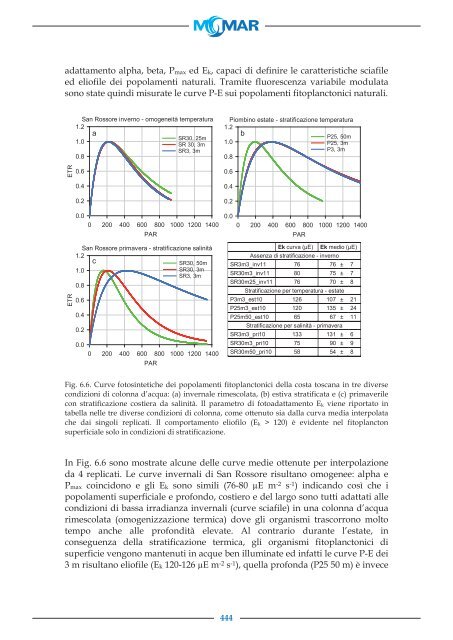
- Page 444 and 445: Serchio) che fertilizzano maggiorme
- Page 448 and 449: quelle a 10 km (specialmente San Ro
- Page 450 and 451: significativi apporti terrigeni e f
- Page 452 and 453: a ph (443) (m -1 ) a* ph (443) (m -
- Page 454 and 455: 6.2.4.4.4. Assorbimento del NAP Ana
- Page 456 and 457: a* NAP (λ) (m 2 mgChl -1 ) a* NAP
- Page 458 and 459: L’attenuazione dell’irradianza
- Page 460 and 461: 6.2.4.4.6.2. Spettri della rifletta
- Page 462 and 463: attive e dalle proporzioni fra la b
- Page 464 and 465: di caso 1. In effetti utilizzando i
- Page 466 and 467: 6.2.5 Le campagne ocenografiche MEL
- Page 468 and 469: Figura Figura 6.18: Stazioni 6.18:
- Page 470 and 471: Figura 6.19: profili di temperatura
- Page 472 and 473: I profili CTD della campagna MELBA
- Page 474 and 475: 6.3 I dati satellitari: MODIS e MER
- Page 476 and 477: Primary Use Band Land/Cloud/Aerosol
- Page 478 and 479: 6.4 Integrazione tra dati in situ e
- Page 480 and 481: R 0.014 0.012 0.01 0.008 0.006 0.00
- Page 482 and 483: 6.5 Valutazione e implementazione d
- Page 484 and 485: Per quanto riguarda i dati della ca
- Page 486 and 487: Figura 6.23: Mappa di clorofilla a
- Page 488 and 489: L’immagine true color indica chia
- Page 490 and 491: In generale, le stime di concentraz
- Page 492 and 493: In generale si evidenzia una maggio
- Page 494 and 495: 6.5.7 Conclusioni I risultati confe
- Page 496 and 497:
Figura 6.28. Schema di funzionament
- Page 498 and 499:
5,25 % 13,16 % 81,59 % TOTALE : 277
- Page 500 and 501:
Materials provided provided to to t
- Page 502 and 503:
Figura 1.33. Un esempio di Oil Spil
- Page 504 and 505:
“Ancillary Data”). Solo per cit
- Page 506 and 507:
Figura 1 - Area di studio 504 2
- Page 508 and 509:
DATI OC HDF Esempio del nome dei fi
- Page 510 and 511:
DATI OC ENVI Esempio dei nomi dei f
- Page 512 and 513:
Figura 7 - Immagine MODIS (True Col
- Page 514 and 515:
DATI SAM_C1 Nell’archivio di dati
- Page 516 and 517:
Bibliografia: Astraldi M., Bacciola
- Page 518 and 519:
IOCCG (2000). Remote sensing of oce
- Page 520 and 521:
Santini, C., Pieri, M., Santoro, E.
- Page 522 and 523:
oriented, e sistemi informativi Web
- Page 524 and 525:
sono quindi simulate diverse config
- Page 526 and 527:
Particolarmente complessa è la fas
- Page 528 and 529:
tipologia delle condizioni iniziali
- Page 530 and 531:
• Interpolazione output di GETM s
- Page 532 and 533:
Orosei 500: Orosei 150: Asinara 500
- Page 534 and 535:
• Run del modello oceanografico d
- Page 536 and 537:
In figura si evidenziano sulla sini
- Page 538 and 539:
L’applicazione Oil Spill È stata
- Page 540 and 541:
- Amministratore del sistema è un
- Page 542 and 543:
(in particolare l’Allegato I, All
- Page 544 and 545:
. data del prelievo relativa alla s
- Page 546 and 547:
Denominazione Posizione geografica
- Page 548 and 549:
Attraverso la sezione Administrativ
- Page 550 and 551:
int int int int GetAllSitesFull F
- Page 552 and 553:
Restituisce oggetti del tipo: 3 S
- Page 554 and 555:
Codice, descrizione breve ed estesa
- Page 556 and 557:
Vedere il metodo getAllSampleFromSi
- Page 558 and 559:
Figura 7.8.1 Descrizione dell’Ent
- Page 560 and 561:
- ‘method indicator’ Una volta
- Page 562 and 563:
- ‘Campaigns definition’ Figura
- Page 564 and 565:
- ‘Campaigns definition’: analy
- Page 566 and 567:
Capitolo 8: LE PROSPETTIVE DEL MONI
- Page 568 and 569:
Nei capitoli precedenti è stato gi
- Page 570 and 571:
2.3 Mappatura della produttività m
- Page 572 and 573:
tirrenico e della eterogeneità deg
- Page 574 and 575:
- dall’altro i sistemi di osserva
- Page 576 and 577:
sulle correnti marine (almeno a lar
- Page 578 and 579:
fra tali misure e le applicazioni c
- Page 580 and 581:
grandezze di interesse anche in sit
- Page 582 and 583:
ignora eventi inquinanti circoscrit
- Page 584 and 585:
dall’altro agevolmente consultabi
- Page 586:
Alvarez, A., and B. Mourre, 2012: O