polÃticas para la agricultura familiar en américa latina y el ... - RUTA
polÃticas para la agricultura familiar en américa latina y el ... - RUTA
polÃticas para la agricultura familiar en américa latina y el ... - RUTA

You also want an ePaper? Increase the reach of your titles
YUMPU automatically turns print PDFs into web optimized ePapers that Google loves.
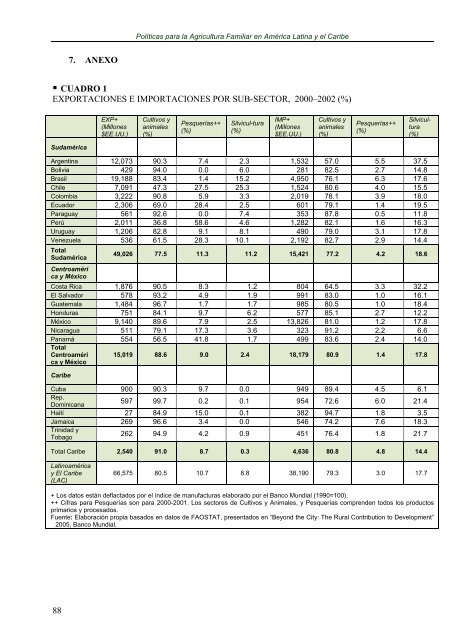
Políticas <strong>para</strong> <strong>la</strong> Agricultura Familiar <strong>en</strong> América Latina y <strong>el</strong> Caribe7. ANEXO• CUADRO 1EXPORTACIONES E IMPORTACIONES POR SUB-SECTOR, 2000–2002 (%)EXP+(Millones$EE.UU.)Cultivos yanimales(%)Pesquerías++(%)Silvicul-tura(%)IMP+(Millones$EE.UU.)Cultivos yanimales(%)Pesquerías++(%)Silvicultura(%)SudaméricaArg<strong>en</strong>tina 12,073 90.3 7.4 2.3 1,532 57.0 5.5 37.5Bolivia 429 94.0 0.0 6.0 281 82.5 2.7 14.8Brasil 19,188 83.4 1.4 15.2 4,950 76.1 6.3 17.6Chile 7,091 47.3 27.5 25.3 1,524 80.6 4.0 15.5Colombia 3,222 90.8 5.9 3.3 2,019 78.1 3.9 18.0Ecuador 2,306 69.0 28.4 2.5 601 79.1 1.4 19.5Paraguay 561 92.6 0.0 7.4 353 87.8 0.5 11.8Perú 2,011 36.8 58.6 4.6 1,282 82.1 1.6 16.3Uruguay 1,206 82.8 9.1 8.1 490 79.0 3.1 17.8V<strong>en</strong>ezue<strong>la</strong> 536 61.5 28.3 10.1 2,192 82.7 2.9 14.4TotalSudamérica49,026 77.5 11.3 11.2 15,421 77.2 4.2 18.6C<strong>en</strong>troamérica y MéxicoCosta Rica 1,876 90.5 8.3 1.2 804 64.5 3.3 32.2El Salvador 578 93.2 4.9 1.9 991 83.0 1.0 16.1Guatema<strong>la</strong> 1,484 96.7 1.7 1.7 985 80.5 1.0 18.4Honduras 751 84.1 9.7 6.2 577 85.1 2.7 12.2México 9,140 89.6 7.9 2.5 13,826 81.0 1.2 17.8Nicaragua 511 79.1 17.3 3.6 323 91.2 2.2 6.6Panamá 554 56.5 41.8 1.7 499 83.6 2.4 14.0TotalC<strong>en</strong>troamérica y México15,019 88.6 9.0 2.4 18,179 80.9 1.4 17.8CaribeCuba 900 90.3 9.7 0.0 949 89.4 4.5 6.1Rep.Dominicana597 99.7 0.2 0.1 954 72.6 6.0 21.4Haití 27 84.9 15.0 0.1 382 94.7 1.8 3.5Jamaica 269 96.6 3.4 0.0 546 74.2 7.6 18.3Trinidad yTobago262 94.9 4.2 0.9 451 76.4 1.8 21.7Total Caribe 2,540 91.0 8.7 0.3 4,636 80.8 4.8 14.4Latinoaméricay El Caribe(LAC)66,575 80.5 10.7 8.8 38,190 79.3 3.0 17.7+ Los datos están def<strong>la</strong>ctados por <strong>el</strong> índice de manufacturas e<strong>la</strong>borado por <strong>el</strong> Banco Mundial (1990=100).++ Cifras <strong>para</strong> Pesquerías son <strong>para</strong> 2000-2001. Los sectores de Cultivos y Animales, y Pesquerías compr<strong>en</strong>d<strong>en</strong> todos los productosprimarios y procesados.Fu<strong>en</strong>te: E<strong>la</strong>boración propia basados <strong>en</strong> datos de FAOSTAT, pres<strong>en</strong>tados <strong>en</strong> “Beyond the City: The Rural Contribution to Dev<strong>el</strong>opm<strong>en</strong>t”2005, Banco Mundial.88