polÃticas para la agricultura familiar en américa latina y el ... - RUTA
polÃticas para la agricultura familiar en américa latina y el ... - RUTA
polÃticas para la agricultura familiar en américa latina y el ... - RUTA

Create successful ePaper yourself
Turn your PDF publications into a flip-book with our unique Google optimized e-Paper software.
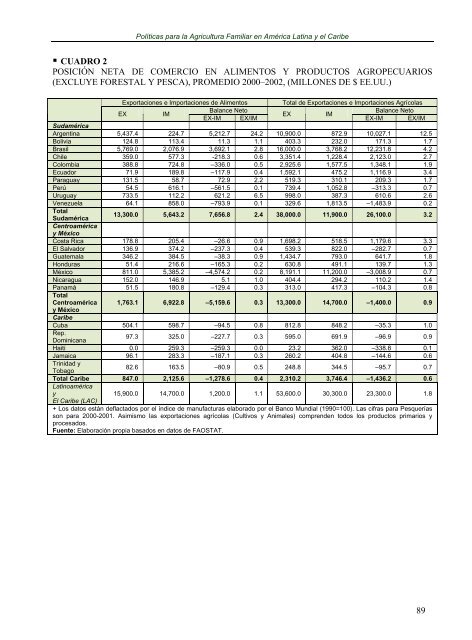
Políticas <strong>para</strong> <strong>la</strong> Agricultura Familiar <strong>en</strong> América Latina y <strong>el</strong> Caribe• CUADRO 2POSICIÓN NETA DE COMERCIO EN ALIMENTOS Y PRODUCTOS AGROPECUARIOS(EXCLUYE FORESTAL Y PESCA), PROMEDIO 2000–2002, (MILLONES DE $ EE.UU.)Exportaciones e Importaciones de Alim<strong>en</strong>tosTotal de Exportaciones e Importaciones Agríco<strong>la</strong>sEXIMBa<strong>la</strong>nce NetoBa<strong>la</strong>nce NetoEXIMEX-IM EX/IMEX-IM EX/IMSudaméricaArg<strong>en</strong>tina 5,437.4 224.7 5,212.7 24.2 10,900.0 872.9 10,027.1 12.5Bolivia 124.8 113.4 11.3 1.1 403.3 232.0 171.3 1.7Brasil 5,769.0 2,076.9 3,692.1 2.8 16,000.0 3,768.2 12,231.8 4.2Chile 359.0 577.3 -218.3 0.6 3,351.4 1,228.4 2,123.0 2.7Colombia 388.8 724.8 –336.0 0.5 2,925.6 1,577.5 1,348.1 1.9Ecuador 71.9 189.8 –117.9 0.4 1,592.1 475.2 1,116.9 3.4Paraguay 131.5 58.7 72.9 2.2 519.3 310.1 209.3 1.7Perú 54.5 616.1 –561.5 0.1 739.4 1,052.8 –313.3 0.7Uruguay 733.5 112.2 621.2 6.5 998.0 387.3 610.6 2.6V<strong>en</strong>ezue<strong>la</strong> 64.1 858.0 –793.9 0.1 329.6 1,813.5 –1,483.9 0.2TotalSudamérica13,300.0 5,643.2 7,656.8 2.4 38,000.0 11,900.0 26,100.0 3.2C<strong>en</strong>troaméricay MéxicoCosta Rica 178.8 205.4 –26.6 0.9 1,698.2 518.5 1,179.6 3.3El Salvador 136.9 374.2 –237.3 0.4 539.3 822.0 –282.7 0.7Guatema<strong>la</strong> 346.2 384.5 –38.3 0.9 1,434.7 793.0 641.7 1.8Honduras 51.4 216.6 –165.3 0.2 630.8 491.1 139.7 1.3México 811.0 5,385.2 –4,574.2 0.2 8,191.1 11,200.0 –3,008.9 0.7Nicaragua 152.0 146.9 5.1 1.0 404.4 294.2 110.2 1.4Panamá 51.5 180.8 –129.4 0.3 313.0 417.3 –104.3 0.8TotalC<strong>en</strong>troamérica 1,763.1 6,922.8 –5,159.6 0.3 13,300.0 14,700.0 –1,400.0 0.9y MéxicoCaribeCuba 504.1 598.7 –94.5 0.8 812.8 848.2 –35.3 1.0Rep.Dominicana97.3 325.0 –227.7 0.3 595.0 691.9 –96.9 0.9Haití 0.0 259.3 –259.3 0.0 23.2 362.0 –338.8 0.1Jamaica 96.1 283.3 –187.1 0.3 260.2 404.8 –144.6 0.6Trinidad yTobago82.6 163.5 –80.9 0.5 248.8 344.5 –95.7 0.7Total Caribe 847.0 2,125.6 –1,278.6 0.4 2,310.2 3,746.4 –1,436.2 0.6Latinoaméricay15,900.0 14,700.0 1,200.0 1.1 53,600.0 30,300.0 23,300.0 1.8El Caribe (LAC)+ Los datos están def<strong>la</strong>ctados por <strong>el</strong> índice de manufacturas e<strong>la</strong>borado por <strong>el</strong> Banco Mundial (1990=100). Las cifras <strong>para</strong> Pesqueríasson <strong>para</strong> 2000-2001. Asimismo <strong>la</strong>s exportaciones agríco<strong>la</strong>s (Cultivos y Animales) compr<strong>en</strong>d<strong>en</strong> todos los productos primarios yprocesados.Fu<strong>en</strong>te: E<strong>la</strong>boración propia basados <strong>en</strong> datos de FAOSTAT.89