thermal power development - Infraline
thermal power development - Infraline
thermal power development - Infraline

You also want an ePaper? Increase the reach of your titles
YUMPU automatically turns print PDFs into web optimized ePapers that Google loves.
Central electricity authority Annual Report 2009-10<br />
Electricity Regulatory Commission for financial<br />
years 2009-10 & 2010-11 has been examined in<br />
respect of issues relating to T&D Losses, Annual<br />
Revenue Requirement, Cost of Supply, Power<br />
Purchase Cost and O&M Expenses, etc.<br />
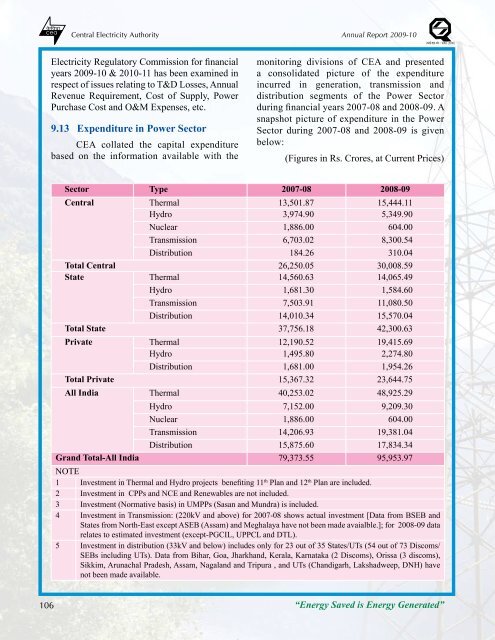
9.13 Expenditure in Power Sector<br />
CEA collated the capital expenditure<br />
based on the information available with the<br />
monitoring divisions of CEA and presented<br />
a consolidated picture of the expenditure<br />
incurred in generation, transmission and<br />
distribution segments of the Power Sector<br />
during financial years 2007-08 and 2008-09. A<br />
snapshot picture of expenditure in the Power<br />
Sector during 2007-08 and 2008-09 is given<br />
below:<br />
(Figures in Rs. Crores, at Current Prices)<br />
Sector Type 2007-08 2008-09<br />
Central Thermal 13,501.87 15,444.11<br />
Hydro 3,974.90 5,349.90<br />
Nuclear 1,886.00 604.00<br />
Transmission 6,703.02 8,300.54<br />
Distribution 184.26 310.04<br />
Total Central 26,250.05 30,008.59<br />
State Thermal 14,560.63 14,065.49<br />
Hydro 1,681.30 1,584.60<br />
Transmission 7,503.91 11,080.50<br />
Distribution 14,010.34 15,570.04<br />
Total State 37,756.18 42,300.63<br />
Private Thermal 12,190.52 19,415.69<br />
Hydro 1,495.80 2,274.80<br />
Distribution 1,681.00 1,954.26<br />
Total Private 15,367.32 23,644.75<br />
All India Thermal 40,253.02 48,925.29<br />
Hydro 7,152.00 9,209.30<br />
Nuclear 1,886.00 604.00<br />
Transmission 14,206.93 19,381.04<br />
Distribution 15,875.60 17,834.34<br />
Grand Total-All India 79,373.55 95,953.97<br />
NOTE<br />
1 Investment in Thermal and Hydro projects benefiting 11 th Plan and 12 th Plan are included.<br />
2 Investment in CPPs and NCE and Renewables are not included.<br />
3 Investment (Normative basis) in UMPPs (Sasan and Mundra) is included.<br />
4 Investment in Transmission: (220kV and above) for 2007-08 shows actual investment [Data from BSEB and<br />
States from North-East except ASEB (Assam) and Meghalaya have not been made avaialble.]; for 2008-09 data<br />
relates to estimated investment (except-PGCIL, UPPCL and DTL).<br />
5 Investment in distribution (33kV and below) includes only for 23 out of 35 States/UTs (54 out of 73 Discoms/<br />
SEBs including UTs). Data from Bihar, Goa, Jharkhand, Kerala, Karnataka (2 Discoms), Orissa (3 discoms),<br />
Sikkim, Arunachal Pradesh, Assam, Nagaland and Tripura , and UTs (Chandigarh, Lakshadweep, DNH) have<br />
not been made available.<br />
106<br />
“Energy Saved is Energy Generated”