thermal power development - Infraline
thermal power development - Infraline
thermal power development - Infraline

You also want an ePaper? Increase the reach of your titles
YUMPU automatically turns print PDFs into web optimized ePapers that Google loves.
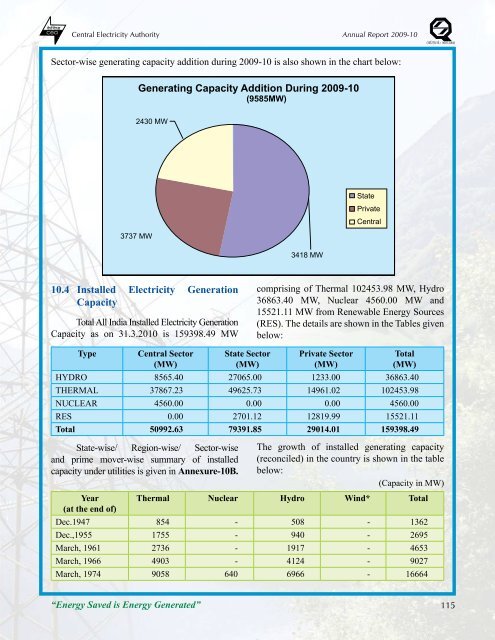
Central electricity authority Annual Report 2009-10<br />
Sector-wise generating capacity addition during 2009-10 is also shown in the chart below:<br />
10.4 Installed Electricity Generation<br />
Capacity<br />
Total All India Installed Electricity Generation<br />
Capacity as on 31.3.2010 is 159398.49 MW<br />
comprising of Thermal 102453.98 MW, Hydro<br />
36863.40 MW, Nuclear 4560.00 MW and<br />
15521.11 MW from Renewable Energy Sources<br />
(RES). The details are shown in the Tables given<br />
below:<br />
Type<br />
Central Sector<br />
(MW)<br />
State Sector<br />
(MW)<br />
Private Sector<br />
(MW)<br />
Total<br />
(MW)<br />
HYDRO 8565.40 27065.00 1233.00 36863.40<br />
THERMAL 37867.23 49625.73 14961.02 102453.98<br />
NUCLEAR 4560.00 0.00 0.00 4560.00<br />
RES 0.00 2701.12 12819.99 15521.11<br />
Total 50992.63 79391.85 29014.01 159398.49<br />
State-wise/ Region-wise/ Sector-wise<br />
and prime mover-wise summary of installed<br />
capacity under utilities is given in Annexure-10B.<br />
The growth of installed generating capacity<br />
(reconciled) in the country is shown in the table<br />
below:<br />
(Capacity in MW)<br />
Year<br />
(at the end of)<br />
Thermal Nuclear Hydro Wind* Total<br />
Dec.1947 854 - 508 - 1362<br />
Dec.,1955 1755 - 940 - 2695<br />
March, 1961 2736 - 1917 - 4653<br />
March, 1966 4903 - 4124 - 9027<br />
March, 1974 9058 640 6966 - 16664<br />
“Energy Saved is Energy Generated”<br />
115