thermal power development - Infraline
thermal power development - Infraline
thermal power development - Infraline

You also want an ePaper? Increase the reach of your titles
YUMPU automatically turns print PDFs into web optimized ePapers that Google loves.
Central electricity authority Annual Report 2009-10<br />
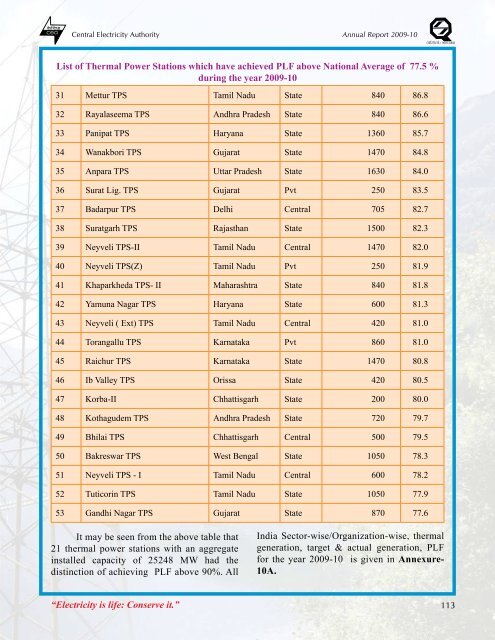
List of Thermal Power Stations which have achieved PLF above National Average of 77.5 %<br />
during the year 2009-10<br />
31 Mettur TPS Tamil Nadu State 840 86.8<br />
32 Rayalaseema TPS Andhra Pradesh State 840 86.6<br />
33 Panipat TPS Haryana State 1360 85.7<br />
34 Wanakbori TPS Gujarat State 1470 84.8<br />
35 Anpara TPS Uttar Pradesh State 1630 84.0<br />
36 Surat Lig. TPS Gujarat Pvt 250 83.5<br />
37 Badarpur TPS Delhi Central 705 82.7<br />
38 Suratgarh TPS Rajasthan State 1500 82.3<br />
39 Neyveli TPS-II Tamil Nadu Central 1470 82.0<br />
40 Neyveli TPS(Z) Tamil Nadu Pvt 250 81.9<br />
41 Khaparkheda TPS- II Maharashtra State 840 81.8<br />
42 Yamuna Nagar TPS Haryana State 600 81.3<br />
43 Neyveli ( Ext) TPS Tamil Nadu Central 420 81.0<br />
44 Torangallu TPS Karnataka Pvt 860 81.0<br />
45 Raichur TPS Karnataka State 1470 80.8<br />
46 Ib Valley TPS Orissa State 420 80.5<br />
47 Korba-II Chhattisgarh State 200 80.0<br />
48 Kothagudem TPS Andhra Pradesh State 720 79.7<br />
49 Bhilai TPS Chhattisgarh Central 500 79.5<br />
50 Bakreswar TPS West Bengal State 1050 78.3<br />
51 Neyveli TPS - I Tamil Nadu Central 600 78.2<br />
52 Tuticorin TPS Tamil Nadu State 1050 77.9<br />
53 Gandhi Nagar TPS Gujarat State 870 77.6<br />
It may be seen from the above table that<br />
21 <strong>thermal</strong> <strong>power</strong> stations with an aggregate<br />
installed capacity of 25248 MW had the<br />
distinction of achieving PLF above 90%. All<br />
India Sector-wise/Organization-wise, <strong>thermal</strong><br />
generation, target & actual generation, PLF<br />
for the year 2009-10 is given in Annexure-<br />
10A.<br />
“Electricity is life: Conserve it.”<br />
113