

Online proceedings - EDA Publishing Association
Online proceedings - EDA Publishing Association
Online proceedings - EDA Publishing Association

Create successful ePaper yourself
Turn your PDF publications into a flip-book with our unique Google optimized e-Paper software.
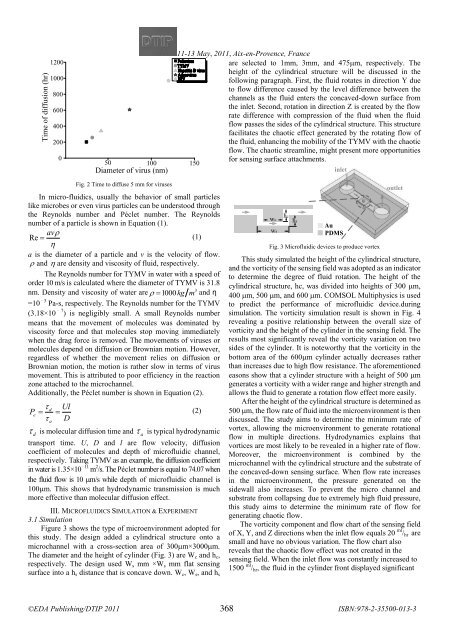
Time of diffusion (hr)<br />
1200<br />
1000<br />
800<br />
600<br />
400<br />
200<br />
0<br />
11-13 <br />
May, 2011, Aix-en-Provence, France<br />
<br />
Poliovirus<br />
TYMV<br />
Hepatitis B virus<br />
Adenovirus<br />
HIV<br />
50 100 150<br />
Diameter of virus (nm)<br />
are selected to 1mm, 3mm, and 475m, respectively. The<br />
height of the cylindrical structure will be discussed in the<br />
following paragraph. First, the fluid rotates in direction Y due<br />
to flow difference caused by the level difference between the<br />
channels as the fluid enters the concaved-down surface from<br />
the inlet. Second, rotation in direction Z is created by the flow<br />
rate difference with compression of the fluid when the fluid<br />
flow passes the sides of the cylindrical structure. This structure<br />
facilitates the chaotic effect generated by the rotating flow of<br />
the fluid, enhancing the mobility of the TYMV with the chaotic<br />
flow. The chaotic streamline, might present more opportunities<br />
for sensing surface attachments.<br />
inlet<br />
Fig. 2 Time to diffuse 5 mm for viruses<br />
In micro-fluidics, usually the behavior of small particles<br />
like microbes or even virus particles can be understood through<br />
the Reynolds number and Péclet number. The Reynolds<br />
number of a particle is shown in Equation (1).<br />
av<br />
Re (1)<br />
<br />
a is the diameter of a particle and v is the velocity of flow.<br />
and are density and viscosity of fluid, respectively.<br />
The Reynolds number for TYMV in water with a speed of<br />
order 10 m/s is calculated where the diameter of TYMV is 31.8<br />
3<br />
nm. Density and viscosity of water are 1000kg m and η<br />
=10 –3 Pa-s, respectively. The Reynolds number for the TYMV<br />
(3.18×10 – 7 ) is negligibly small. A small Reynolds number<br />
means that the movement of molecules was dominated by<br />
viscosity force and that molecules stop moving immediately<br />
when the drag force is removed. The movements of viruses or<br />
molecules depend on diffusion or Brownian motion. However,<br />
regardless of whether the movement relies on diffusion or<br />
Brownian motion, the motion is rather slow in terms of virus<br />
movement. This is attributed to poor efficiency in the reaction<br />
zone attached to the microchannel.<br />
Additionally, the Péclet number is shown in Equation (2).<br />
<br />
Ul<br />
d<br />
Pe<br />
(2)<br />
<br />
a<br />
D<br />
<br />
d<br />
is molecular diffusion time and<br />
a<br />
is typical hydrodynamic<br />
transport time. U, D and l are flow velocity, diffusion<br />
coefficient of molecules and depth of microfluidic channel,<br />
respectively. Taking TYMV as an example, the diffusion coefficient<br />
in water is 1.35×10 –11 m 2 /s. The Péclet number is equal to 74.07 when<br />
the fluid flow is 10 m/s while depth of microfluidic channel is<br />
100m. This shows that hydrodynamic transmission is much<br />
more effective than molecular diffusion effect.<br />
III. MICROFLUIDICS SIMULATION & EXPERIMENT<br />
3.1 Simulation<br />
Figure 3 shows the type of microenvironment adopted for<br />
this study. The design added a cylindrical structure onto a<br />
microchannel with a cross-section area of 300m×3000m.<br />
The diameter and the height of cylinder (Fig. 3) are W c and h c ,<br />
respectively. The design used W s mm ×W s mm flat sensing<br />
surface into a h s distance that is concave down. W c , W s , and h s<br />
wc<br />
ws<br />
hc<br />
hs<br />
Au<br />
PDMS<br />
Fig. 3 Microfluidic devices to produce vortex<br />
outlet<br />
This study simulated the height of the cylindrical structure,<br />
and the vorticity of the sensing field was adopted as an indicator<br />
to determine the degree of fluid rotation. The height of the<br />
cylindrical structure, hc, was divided into heights of 300 m,<br />
400 m, 500 m, and 600 m. COMSOL Multiphysics is used<br />
to predict the performance of microfluidic device.during<br />
simulation. The vorticity simulation result is shown in Fig. 4<br />
revealing a positive relationship between the overall size of<br />
vorticity and the height of the cylinder in the sensing field. The<br />
results most significantly reveal the vorticity variation on two<br />
sides of the cylinder. It is noteworthy that the vorticity in the<br />
bottom area of the 600m cylinder actually decreases rather<br />
than increases due to high flow resistance. The aforementioned<br />
easons show that a cylinder structure with a height of 500 m<br />
generates a vorticity with a wider range and higher strength and<br />
allows the fluid to generate a rotation flow effect more easily.<br />
After the height of the cylindrical structure is determined as<br />
500 m, the flow rate of fluid into the microenvironment is then<br />
discussed. The study aims to determine the minimum rate of<br />
vortex, allowing the microenvironment to generate rotational<br />
flow in multiple directions. Hydrodynamics explains that<br />
vortices are most likely to be revealed in a higher rate of flow.<br />
Moreover, the microenvironment is combined by the<br />
microchannel with the cylindrical structure and the substrate of<br />
the concaved-down sensing surface. When flow rate increases<br />
in the microenvironment, the pressure generated on the<br />
sidewall also increases. To prevent the micro channel and<br />
substrate from collapsing due to extremely high fluid pressure,<br />
this study aims to determine the minimum rate of flow for<br />
generating chaotic flow.<br />
The vorticity component and flow chart of the sensing field<br />
of X, Y, and Z directions when the inlet flow equals 20 ml / hr are<br />
small and have no obvious variation. The flow chart also<br />
reveals that the chaotic flow effect was not created in the<br />
sensing field. When the inlet flow was constantly increased to<br />
1500 ml / hr , the fluid in the cylinder front displayed significant<br />
368


