- Page 1 and 2:
TABLE OF CONTENTS SCIENCE K-12 CURR
- Page 3 and 4:
LINDBERGH SCHOOL DISTRICT Rationale
- Page 5 and 6:
Show-Me Performance Standards Goal
- Page 7 and 8:
Elementary School Rationale: The te
- Page 9 and 10:
Strand 1: Properties and Principles
- Page 11 and 12:
Strand 2: Properties and Principles
- Page 13 and 14:
Strand 4: Changes in Ecosystems and
- Page 15 and 16:
Strand 6: Composition and Structure
- Page 17 and 18:
Strand 7: Scientific Inquiry 1. Sci
- Page 19 and 20:
Strand 8: Impact of Science, Techno
- Page 21 and 22:
First Grade Rationale: The teaching
- Page 23 and 24:
Strand 1: Properties and Principles
- Page 25 and 26:
Strand 2: Properties and Principles
- Page 27 and 28:
Concept D: Plants and animals have
- Page 29 and 30:
Strand 5: Processes and Interaction
- Page 31 and 32:
. Plan and conduct a simple investi
- Page 33 and 34:
Concept E: The nature of science re
- Page 35 and 36: Second Grade Rationale: The teachin
- Page 37 and 38: Strand 1: Properties and Principles
- Page 39 and 40: Concept D: The interaction of mass
- Page 41 and 42: Strand 3: Characteristic and Intera
- Page 43 and 44: Strand 5: Processes and Interaction
- Page 45 and 46: Strand 5: Processes and Interaction
- Page 47 and 48: Strand 7: Scientific Inquiry 1. Sci
- Page 49 and 50: Strand 7: Scientific Inquiry 1. Sci
- Page 51 and 52: Standard 8: Impact of Science, Tech
- Page 53 and 54: Strand 1: Properties and Principles
- Page 55 and 56: Strand 1: Properties and Principles
- Page 57 and 58: Strand 3: Characteristic and Intera
- Page 59 and 60: Strand 5: Processes and Interaction
- Page 61 and 62: Strand 6: Composition and Structure
- Page 63 and 64: Strand 7: Scientific Inquiry 1. Sci
- Page 65 and 66: Concept C: Evidence is used to form
- Page 67 and 68: Strand 8: Impact of Science, Techno
- Page 69 and 70: . Work with a group to solve a prob
- Page 71 and 72: Strand 1: Properties and Principles
- Page 73 and 74: Strand 1: Properties and Principles
- Page 75 and 76: Strand 2: Properties and Principles
- Page 77 and 78: objects (attract or repel). desktop
- Page 79 and 80: Strand 4: Changes in Ecosystems and
- Page 81 and 82: Concept C: Natural selection is the
- Page 83 and 84: Strand 5: Processes and Interaction
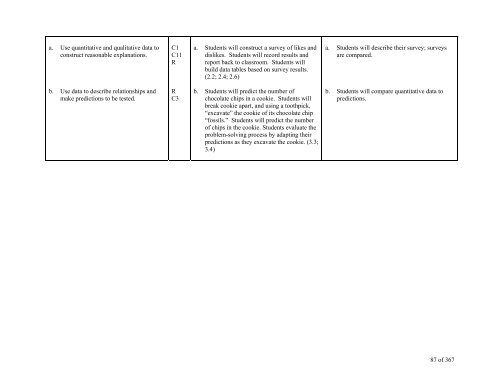
- Page 85: Strand 7: Scientific Inquiry 1. Sci
- Page 89 and 90: Concept E: The nature of science re
- Page 91 and 92: Strand 8: Impact of Science, Techno
- Page 93 and 94: Fifth Grade Rationale: The teaching
- Page 95 and 96: Strand 1: Properties and Principles
- Page 97 and 98: Concept D: The interaction of mass
- Page 99 and 100: Concept E: Biological classificatio
- Page 101 and 102: Strand 5: Processes and Interaction
- Page 103 and 104: Strand 6: Composition and Structure
- Page 105 and 106: Concept C: The regular and predicta
- Page 107 and 108: Strand 7: Scientific Inquiry 1. Sci
- Page 109 and 110: Strand 7: Scientific Inquiry 1. Sci
- Page 111 and 112: Concept B: Advances in technology o
- Page 113 and 114: Middle School Rationale: The import
- Page 115 and 116: Major Objectives IS Suggested Activ
- Page 117 and 118: Strand 1: Properties and Principles
- Page 119 and 120: Concept H: Chemical bonding is the
- Page 121 and 122: away from the source through a medi
- Page 123 and 124: Strand 2: Properties and Principles
- Page 125 and 126: Concept C: Cells are the fundamenta
- Page 127 and 128: synthesis or breakdown of organic c
- Page 129 and 130: Concept B: Living organisms have th
- Page 131 and 132: Strand 4: Changes in Ecosystems and
- Page 133 and 134: Concept B: The hydrosphere is compo
- Page 135 and 136: Strand 5: Processes and Interaction
- Page 137 and 138:
Strand 6: Composition and Structure
- Page 139 and 140:
constants, multiple trials, a valid
- Page 141 and 142:
C1-12 average and compare. (1.1, 1.
- Page 143 and 144:
. Interpret data in order to make a
- Page 145 and 146:
Concept B: Scientific theories are
- Page 147 and 148:
Concept D: Scientific information i
- Page 149 and 150:
Strand 1: Properties and Principles
- Page 151 and 152:
Strand 1: Properties and Principles
- Page 153 and 154:
n. Identify advantages and disadvan
- Page 155 and 156:
Strand 2: Properties and Principles
- Page 157 and 158:
c. Compare the amount of gravitatio
- Page 159 and 160:
Strand 3: Characteristic and Intera
- Page 161 and 162:
. Identify some common diseases (i.
- Page 163 and 164:
Strand 4: Changes in Ecosystems and
- Page 165 and 166:
Strand 5: Processes and Interaction
- Page 167 and 168:
a. Explain and trace the possible p
- Page 169 and 170:
predict the next day’s weather f.
- Page 171 and 172:
a. Describe how the Earth’s place
- Page 173 and 174:
Strand 6: Composition and Structure
- Page 175 and 176:
e. Relate the apparent change in th
- Page 177 and 178:
f. Recognize that the phases of the
- Page 179 and 180:
d. Evaluate the design of an experi
- Page 181 and 182:
measured data and check to see if t
- Page 183 and 184:
communication and defense of logica
- Page 185 and 186:
Describe how the contributions of s
- Page 187 and 188:
in society think about themselves,
- Page 189 and 190:
Strand 1: Properties and Principles
- Page 191 and 192:
Strand 1: Properties and Principles
- Page 193 and 194:
Strand 1: Properties and Principles
- Page 195 and 196:
Strand 2: Properties and Principles
- Page 197 and 198:
Strand 3: Characteristic and Intera
- Page 199 and 200:
into the blood stream, and exits th
- Page 201 and 202:
Strand 3: Characteristic and Intera
- Page 203 and 204:
Strand 4: Changes in Ecosystems and
- Page 205 and 206:
Strand 5: Processes and Interaction
- Page 207 and 208:
Strand 5: Processes and Interaction
- Page 209 and 210:
Strand 5: Processes and Interaction
- Page 211 and 212:
Strand 7: Scientific Inquiry 1. Sci
- Page 213 and 214:
Strand 7: Scientific Inquiry 1. Sci
- Page 215 and 216:
c. Recognize the possible effects o
- Page 217 and 218:
Strand 8: Impact of Science, Techno
- Page 219 and 220:
Strand 8: Impact of Science, Techno
- Page 221 and 222:
Concept C: Scientific ethics requir
- Page 223 and 224:
Biology Rationale: The Lindbergh Sc
- Page 225 and 226:
Concept C: Energy Flow in Ecosystem
- Page 227 and 228:
Standard 2: Life of a Cell Major Ob
- Page 229 and 230:
Standard 3: Reproduction Major Obje
- Page 231 and 232:
Standard 4: DNA & Protein Synthesis
- Page 233 and 234:
Concept C: Genetics Explain how sex
- Page 235 and 236:
Concept D: Microevolution Identify
- Page 237 and 238:
Strand 1: Major Objectives IS Sugge
- Page 239 and 240:
Concept B: Enzymes Discuss enzyme s
- Page 241 and 242:
Concept B: Embryological Developmen
- Page 243 and 244:
expression of a genetic disorder (h
- Page 245 and 246:
Concept D: Microevolution Identify
- Page 247 and 248:
Concept A: Interdependence of Organ
- Page 249 and 250:
Physical Science Rationale: The Lin
- Page 251 and 252:
2.1.B.b Calculate the acceleration
- Page 253 and 254:
acceleration of two objects, compar
- Page 255 and 256:
and its velocity STRAND 7C, 7D, 8.2
- Page 257 and 258:
another within and between systems,
- Page 259 and 260:
(Geosphere, Atmosphere, and Hydrosp
- Page 261 and 262:
Objects within It 3. Regular and pr
- Page 263 and 264:
Concept A: The apparent position of
- Page 265 and 266:
4. Human activity is dependent upon
- Page 267 and 268:
5.2.B.e & f Describe the effects of
- Page 269 and 270:
Physical Science - Honors Rationale
- Page 271 and 272:
made of, have properties that can b
- Page 273 and 274:
force on every other object Compare
- Page 275 and 276:
Concept B: Newton’s Laws of Motio
- Page 277 and 278:
(e.g., car moving on rollercoaster
- Page 279 and 280:
Strand 1: Properties and Principles
- Page 281 and 282:
Concept A: Forms of energy have a s
- Page 283 and 284:
made of, have properties that can b
- Page 285 and 286:
Concept E: The atomic model describ
- Page 287 and 288:
Concept H: Chemical bonding is the
- Page 289 and 290:
Strand 1: Properties and Principles
- Page 291 and 292:
Strand 1: Matter, Atoms, and the Pe
- Page 293 and 294:
Concept: Electromagnetic Energy and
- Page 295 and 296:
Strand 4: Chemical Quantities and S
- Page 297 and 298:
concentrations, properties, and int
- Page 299 and 300:
Concept: Nuclear Contrast the diffe
- Page 301 and 302:
AP/IB Chemistry 1 Rationale: The Li
- Page 303 and 304:
Standard 4: Reactions in Aqueous So
- Page 305 and 306:
Standard 9: Liquids and Solids Majo
- Page 307 and 308:
AP/IB Biology 1 Rationale: The Lind
- Page 309 and 310:
Standard 4: Molecular Biology Measu
- Page 311 and 312:
Strand 1: Circular Motion Major Obj
- Page 313 and 314:
Strand 3: Electrostatics Major Obje
- Page 315 and 316:
Apply vector addition to conditions
- Page 317 and 318:
Strand 8: Linear Momentum Major Obj
- Page 319 and 320:
Prove independence of vertical and
- Page 321 and 322:
Astronomy Rationale: The Lindbergh
- Page 323 and 324:
Standard 3: Solar System Major Obje
- Page 325 and 326:
Strand 1: Botony Major Objectives I
- Page 327 and 328:
AP/IB Chemistry 2 Rationale: The Li
- Page 329 and 330:
Strand 4: Acid-Base Equilibria Majo
- Page 331 and 332:
Earth Science Rationale: The Lindbe
- Page 333 and 334:
Strand 5: Processes and Interaction
- Page 335 and 336:
Objective: Changes in the Earth ove
- Page 337 and 338:
Concept C: The atmosphere (air) is
- Page 339 and 340:
339 of 367
- Page 341 and 342:
Strand 1: Atmosphere Major Objectiv
- Page 343 and 344:
Strand 5: Resource Management Major
- Page 345 and 346:
Strand 1: Blood and Heart Major Obj
- Page 347 and 348:
Strand 5: Cell Structures and Funct
- Page 349 and 350:
Strand 8: How the Human Body is Org
- Page 351 and 352:
Strand 11: Human Reproductive Syste
- Page 353 and 354:
Strand 14: Muscular System Major Ob
- Page 355 and 356:
Strand 21: Tissues, Glands, and Mem
- Page 357 and 358:
Strand 1: Circular Motion Major Obj
- Page 359 and 360:
Strand 3: Forces and Vectors Major
- Page 361 and 362:
Strand 5: Linear Momentum Major Obj
- Page 363 and 364:
AP Physics 2 Rationale: The Lindber
- Page 365 and 366:
Major Objectives IS Suggested Activ
- Page 367:
Calculate the energy required to ra